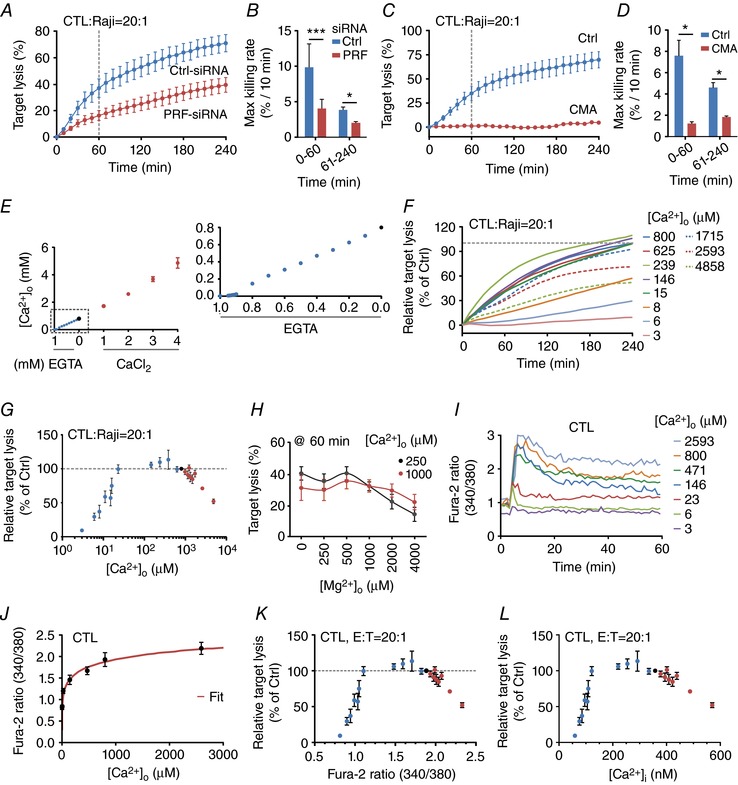
Figure 1. Ca2+ dependence of perforin‐dependent CTL cytotoxicity.

A and B, real‐time killing assay using SEA‐stimulated CTLs as effector and SEA‐pulsed Raji cells as target cells with an E:T ratio of 20:1 (A) and the statistical analysis of the maximal killing rate (B) in perforin down‐regulated CTLs (PRF‐siRNA, n = 4 independent experiments) in comparison to the mean of control siRNA transfected CTLs (Ctrl‐siRNA, n = 4 independent experiments). C and D, real‐time killing assay in CMA‐treated CTLs with SEA‐pulsed Raji cells as target cells with an E:T ratio of 20:1 (C, CMA n = 2 or Ctrl n = 4 independent experiments) and the statistical analysis of the maximal killing rate (D). E, measurement of [Ca2+]o in AIM V medium (black circle) with the addition of EGTA (blue circles) or CaCl2 (red circles) using a Ca2+‐selective electrode or a blood gas analyser. Each data point was measured independently 2–6 times. If no error bars are shown, they are smaller than the points themselves. F, real‐time killing assay with SEA‐pulsed Raji cells as target cells with an E:T ratio of 20:1 in different [Ca2+]o (values as indicated) manipulated by the addition of EGTA (continuous lines) or CaCl2 (dashed lines). Data are normalized to target lysis in 800 μm [Ca2+]o after 4 h. Data are from 2–17 different donors and 4–24 experiments for each [Ca2+]o. G, statistical analysis of the relative target lysis after 4 h plotted against the [Ca2+]o. Data are from 2–17 different donors and 4–24 experiments. Data points in blue represent AIM V medium with added EGTA, in red AIM V medium with added CaCl2 and the data point in black represents AIM V medium. H, statistical analysis of real‐time killing assay with SEA‐pulsed Raji cells as target cells with an E:T ratio of 20:1 at 60 min plotted against different Mg2+ (0–4000 μm) concentrations. The Ca2+ concentration was fixed to 250 and 1000 μm. Data are shown as mean ± SEM from 5–15 donors with 5–18 experiments. I, average Ca2+ ratio values of CTL forming an IS with Raji target cells in AIM V medium with the indicated [Ca2+]o. Fura‐2 ratio kinetics were temporally aligned before averaging. J, steady state values for Fura‐2 ratios of CTLs in contact with target cells (shown in I) plotted against the corresponding [Ca2+]o values. Data were fitted by a Hill equation using Igor Pro 6.22A (red line). K, relative target lysis of CTLs (normalized to target lysis in AIM V medium) is plotted against plateau Fura‐2 ratios during target contact. Fura‐2 ratios were calculated based on [Ca2+]o using the Hill function from Fig. 1J. Data points in blue represent AIM V medium with added EGTA, in red AIM V medium with added CaCl2 and the data point in black represents AIM V medium. L, relative target lysis of CTLs (normalized to target lysis in AIM V medium) plotted against plateau [Ca2+]i of CTLs during contact with target cells. [Ca2+]i values were derived by in situ calibration of Fura‐2 as described in Methods. Data points in blue represent AIM V medium with added EGTA, in red AIM V medium with added CaCl2 and the data point in black represents AIM V medium.
