
Figure 6. Ca2+ dependence of lytic granule release.
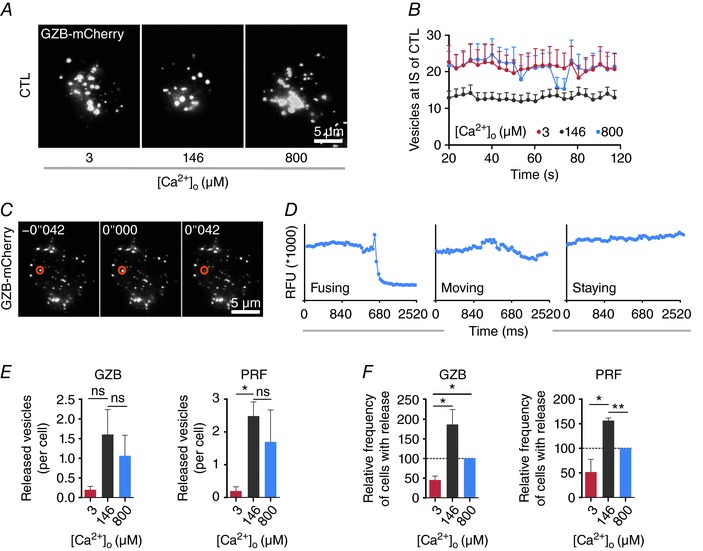
A, snapshots of LG accumulation stained with granzyme B–mCherry at the IS. Anti‐CD3/anti‐CD28 bead‐stimulated CTLs were transfected with granzyme B–mCherry and settled onto anti‐CD3/anti‐CD28/anti‐LFA‐1 antibody‐coated coverslips in modified Ringer solution containing 0 mm Ca2+ and then switched to AIM V with indicated [Ca2+]o. Images were taken at TIRF mode with a penetration depth of 110 nm. Scale bar is 5 μm. B, quantification of the accumulated granzyme B‐positive LGs at the IS. Data are shown as mean + SEM from 3 independent experiments. C, sequential images of a fusing LG at IS. CTLs were transfected with granzyme B–mCherry and were settled onto anti‐CD3/anti‐CD28/anti‐LFA‐1 antibody‐coated coverslips in modified Ringer solution containing 0 mm Ca2+ and then switched to AIM V with indicated [Ca2+]o. The orange cycle indicates a LG fusing at 42 ms. Scale bar is 5 μm. D, defining LG release by analysing the fluorescence intensity. The region of interest (ROI) covers the individual LG and the fluorescence intensity of the ROI is depicted over time. E, quantitative analysis of granzyme B or perforin positive LG fusion at different [Ca2+]o. CTLs were transfected with granzyme B–mCherry or perforin–mCherrry. The number of released LGs containing either granzyme B or perforin was analysed at different [Ca2+]o (3, 146 or 800 μm) during an interval of 2 min after Ca2+ application (n = 49 cells for 3 μm, n = 48 cells for 146 μm and n = 43 cells for 800 μm [Ca2+]o). Data are from 4 independent experiments from 4 donors. F, quantification of the relative frequency of cells with LG release (at least one fused LG). Cells are taken from E (n= 20 cells for 3 μm, n = 22 cells for 146 μm and n = 15 cells for 800 μm [Ca2+]o). Frequency at 800 μm [Ca2+]o was set as 100%. Data are from 4 independent experiments of 4 donors.