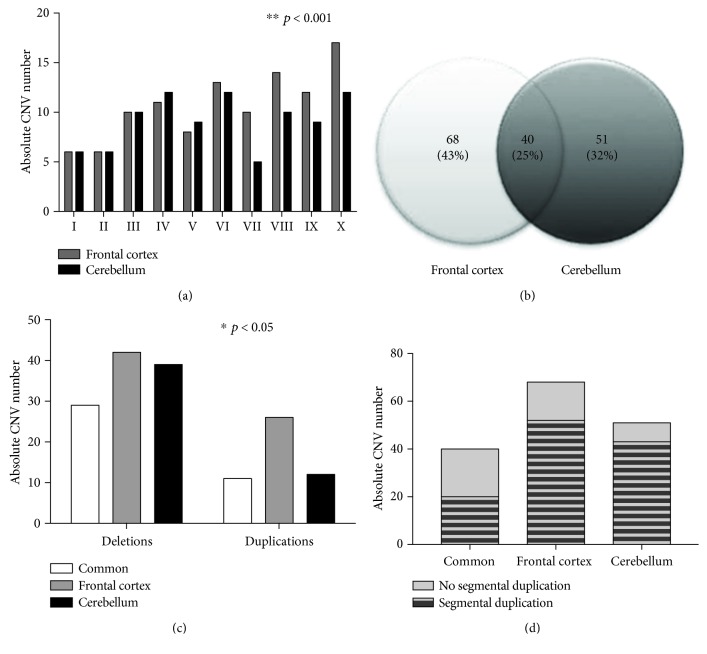
Figure 2.
Distribution of DNA copy number variations (CNVs) between two neural tissues from the same individuals. (a) Comparison of the absolute number of CNVs detected in the frontal cortex and cerebellum from 10 paired individuals; ∗∗ p < 0.001 for comparison between individuals, two-way ANOVA. (b) Venn diagram showing the proportion of CNVs observed in the frontal cortex and cerebellum. (c) Total number of deletions and duplications observed in the CNVs in common to both neural tissues and in the unique CNVs from the frontal cortex and cerebellum; ∗ p < 0.05 for comparisons between the compared groups as well as deletions and duplications, two-way ANOVA. (d) Proportion of segmental duplications identified in the CNVs in common to both neural tissues and in the unique CNVs from the frontal cortex and cerebellum.

