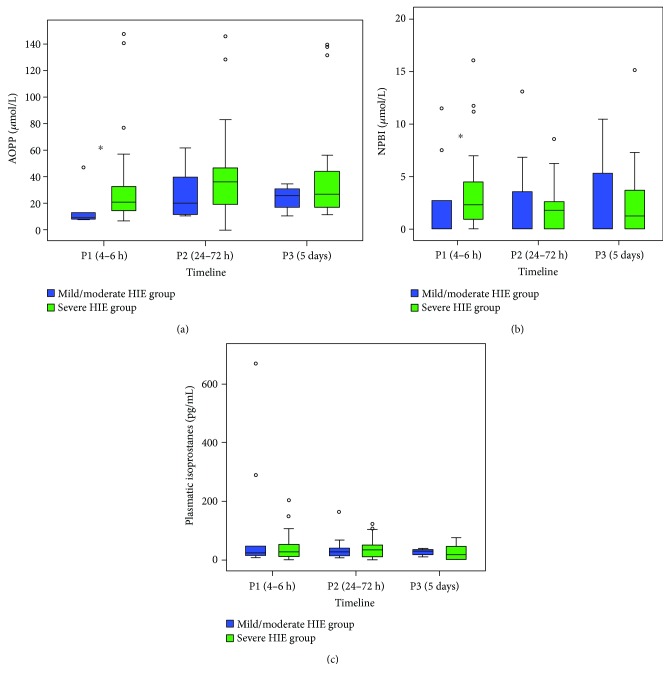
Figure 1.
Relationship between OS biomarkers and the grade of perinatal hypoxia reported over time. Comparison of AOPP levels (μmol/L) (a), NPBI levels (μmol/L) (b), and IsoP levels (pg/mL) (c), between each group in the first 5 days of life. AOPP: advanced oxidation protein products; NPBI: non-protein-bound iron; ◦: outliers. ∗p < 0.05.

