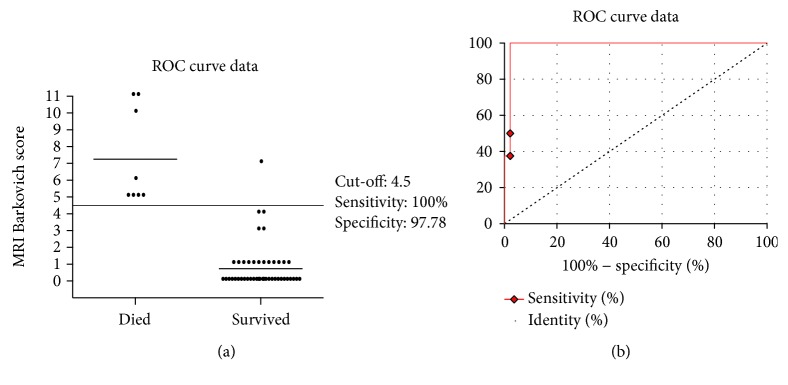
Figure 3.
ROC curve analysis for the MRI score. The MRI score plotted curve indicated 4.5 as the best predictive threshold with a sensitivity of 100% (95% CI 63.06–100) and a specificity of 97.7% (95% CI 88.2–99.9). ROC curve discriminate newborns with a major risk to die from newborns surviving without impairments.

