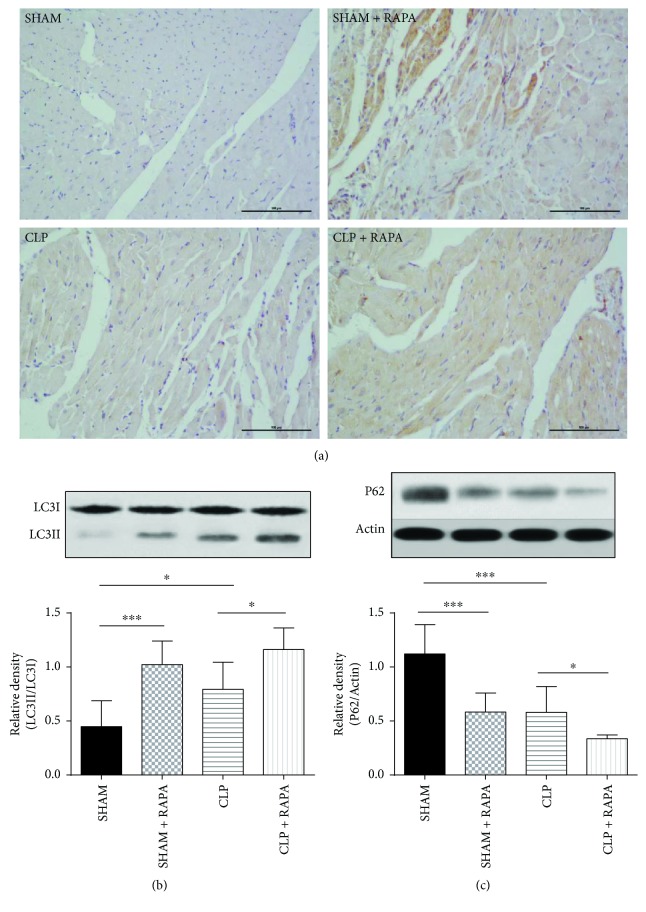
Figure 5.
Effects of rapamycin on LC3-II and P62 expression in the left ventricle 18 h after CLP. (a) The left ventricle sections stained with an anti-LC3 antibody. Magnification, ×200. Bar, 100 μm. (b, c) LC3II and p62 expression in the left ventricle. The left ventricle was harvested at 18 h after CLP, and LC3II and P62 protein levels were quantified by western blotting. Mean ± SD, six rats per group, ∗p < 0.05; ∗∗∗p < 0.001.

