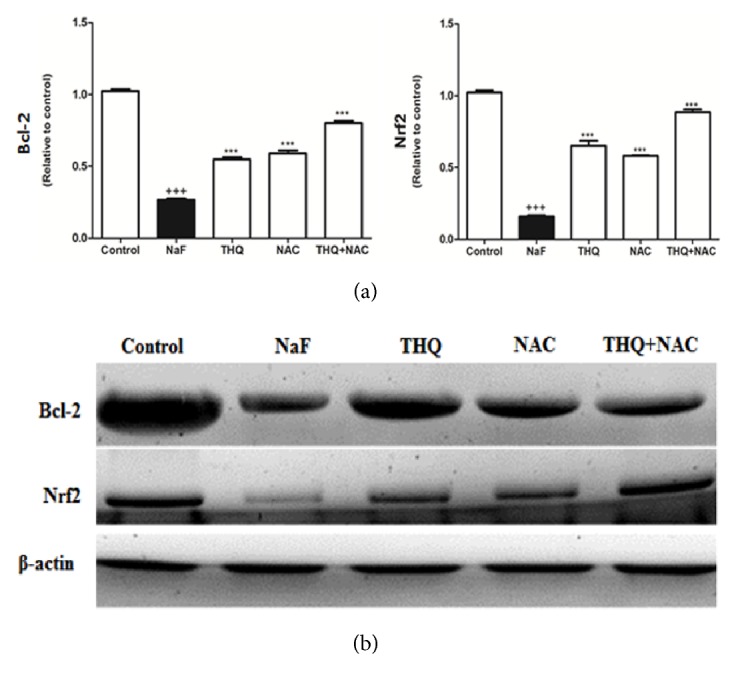
Figure 3.

(a) The densitometry analysis of the expression of Bcl-2 and Nrf2 proteins in control, NaF-intoxicated, and all treated groups. (b) Western blot analysis of the expression of Bcl-2 and Nrf2 proteins in control, NaF-intoxicated, and all treated groups. NaF: sodium fluoride; NAC: N-acetylcysteine; THQ: thymoquinone; Bcl-2: B-cell lymphoma/leukemia-2; Nrf2: NF-E2-related factor 2. Notes: Data are presented as mean ± SEM (N=6). +++p≤ 0.001 versus control, and ∗∗∗p≤ 0.001 versus NaF-intoxicated group.
