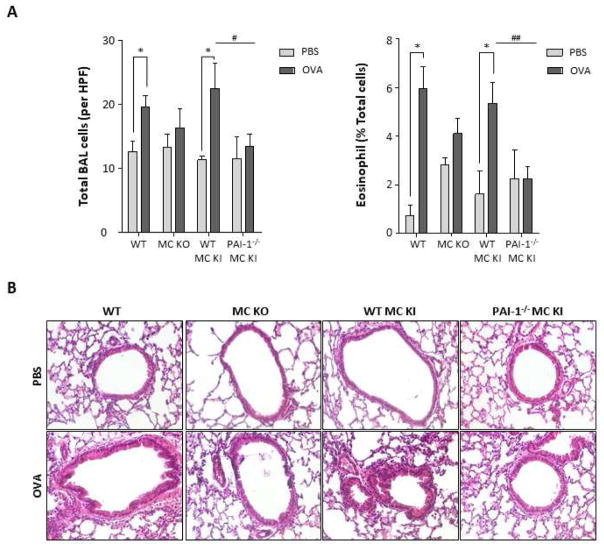
Figure 1. Inflammation in the lung tissues of PBS- or OVA- challenged mice.
(A) Number of total inflammatory cells and eosinophils per high power field (HPF) in the BALF from PBS or OVA-challenged mice. * p <0.05 versus PBS group. (B) Representative hematoxylin and eosin (H&E) staining for histopathologic changes in lung sections of PBS- or OVA-challenged mice. Data are expressed as the means ± SE. A, WT mice; B, Kitw-sh/w-sh mice; C, WT BMCMCs→ Kitw-sh/w-sh mice; D, PAI1−/− BMCMCs→ Kitw-sh/w-sh mice.

