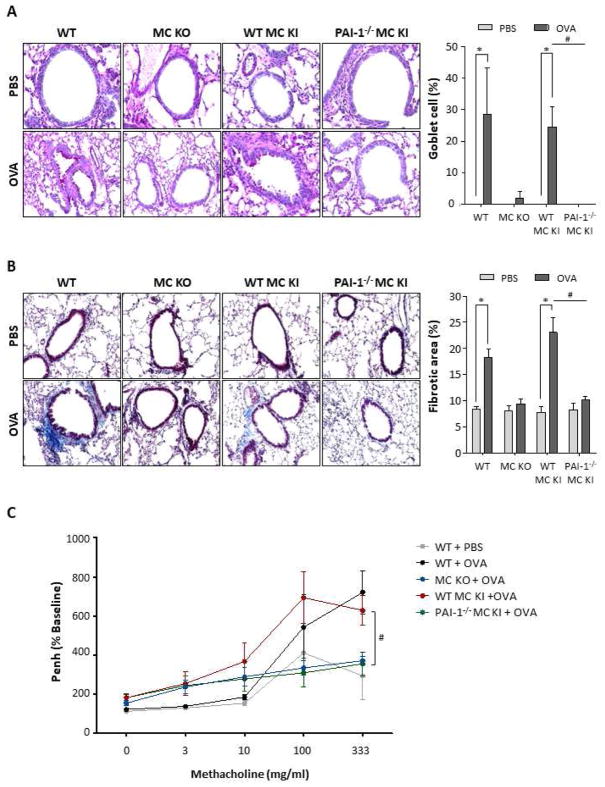
Figure 2. Airway remodeling in the lung tissues of PBS- or OVA- challenged mice.
(A) Lung sections were stained with periodic acid-Schiff (PAS) stain to assess goblet cell hyperplasia. Original magnification, 400x. The number of PAS-positive cells per 100 μm of basement membrane is visualized graphically using Image J (right panel). * p <0.05 versus PBS group. (B) Masson’s trichrome staining was conducted to evaluate collagen deposition (blue). Original magnification, 200x. * p <0.05 versus PBS group. (C) The Airway hyperresponsiveness (AHR) to increasing concentrations of methacholine (0–333 mg/ml) was measured by the Buxco apparatus, and was reported as percent change of enhanced minute pause (Penh) per baseline value. #p <0.05 versus OVA challenged WT BMCMCs→ Kitw-sh/w-sh mice. All data are expressed as the means ± SE. A, WT mice; B, Kitw-sh/w-sh mice; C, WT BMCMCs→ Kitw-sh/w-sh mice; D, PAI1−/− BMCMCs→ Kitw-sh/w-sh mice.

