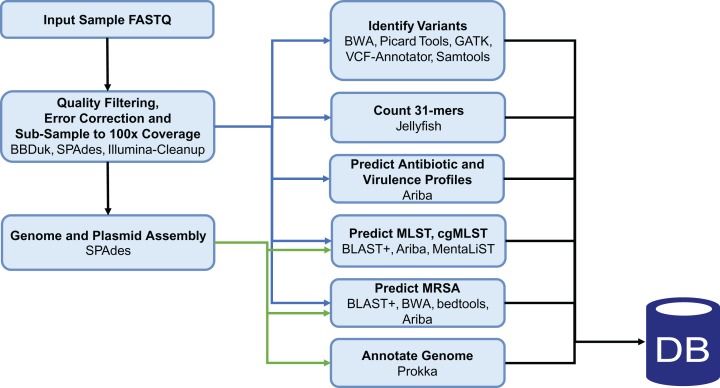
Figure 2. Staphopia Analysis Pipeline (StAP) Workflow.
The diagram describes basic operations of the pipeline on a single genome input (FASTQ file) before uploading into the Postgres relational database. Details of the programs used are in the ‘Methods’ section and in DOI 10.5281/zenodo.1255310. Green arrows indicate input from de novo assembled contigs; blue arrows were operations performed on pFASTQ files.

