
Figure 3.
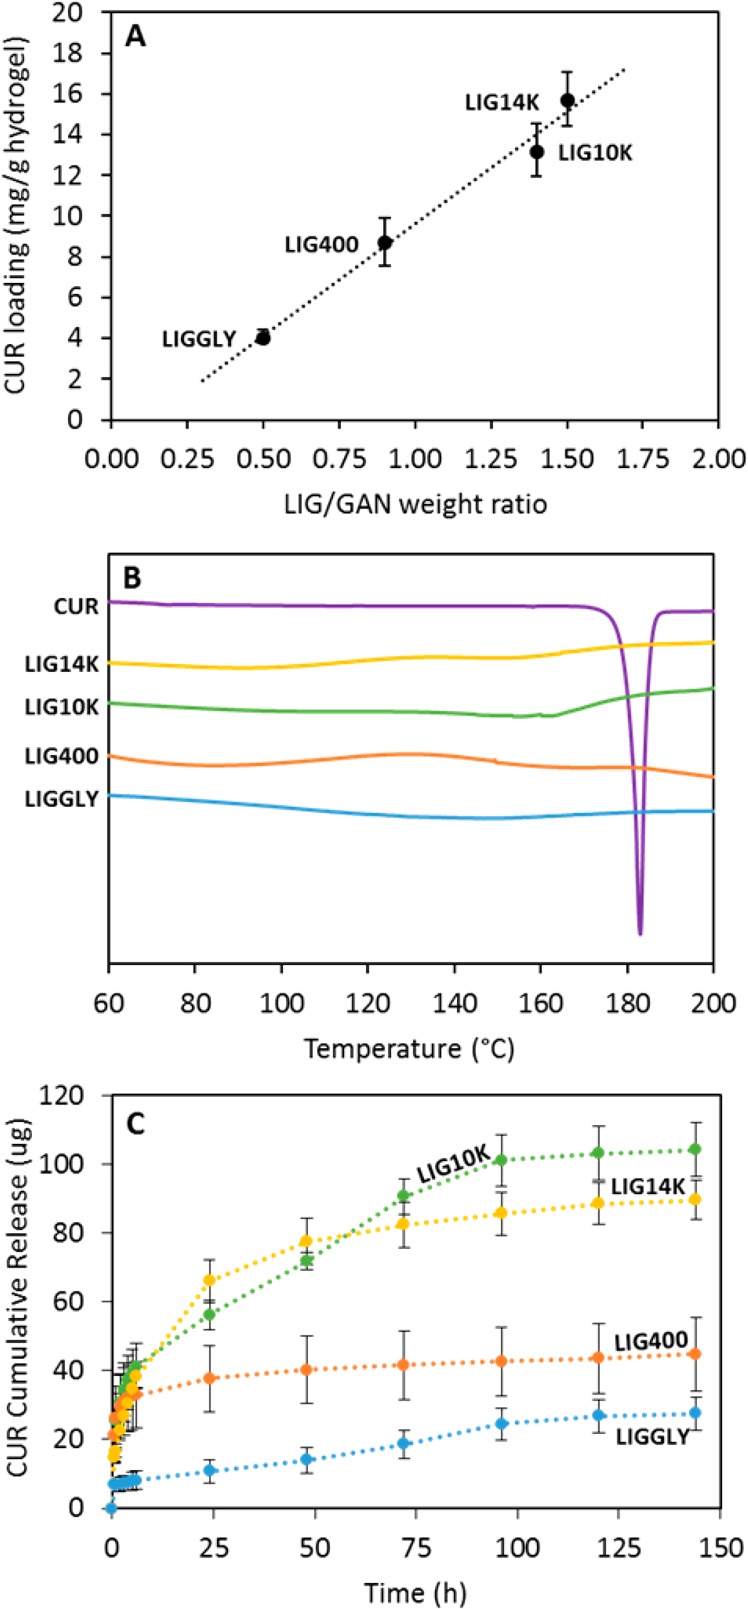
Correlation between the CUR loading and the LIG/GAN weight ratio in the hydrogels (n = 3) (A). DSC curves for CUR and CUR loaded hydrogels (B). For all thermograms: Exo Up. CUR cumulative release from all the hydrogels (C). (n = 3).
Official websites use .gov
A
.gov website belongs to an official
government organization in the United States.
Secure .gov websites use HTTPS
A lock (
) or https:// means you've safely
connected to the .gov website. Share sensitive
information only on official, secure websites.
Correlation between the CUR loading and the LIG/GAN weight ratio in the hydrogels (n = 3) (A). DSC curves for CUR and CUR loaded hydrogels (B). For all thermograms: Exo Up. CUR cumulative release from all the hydrogels (C). (n = 3).