
Figure 3.
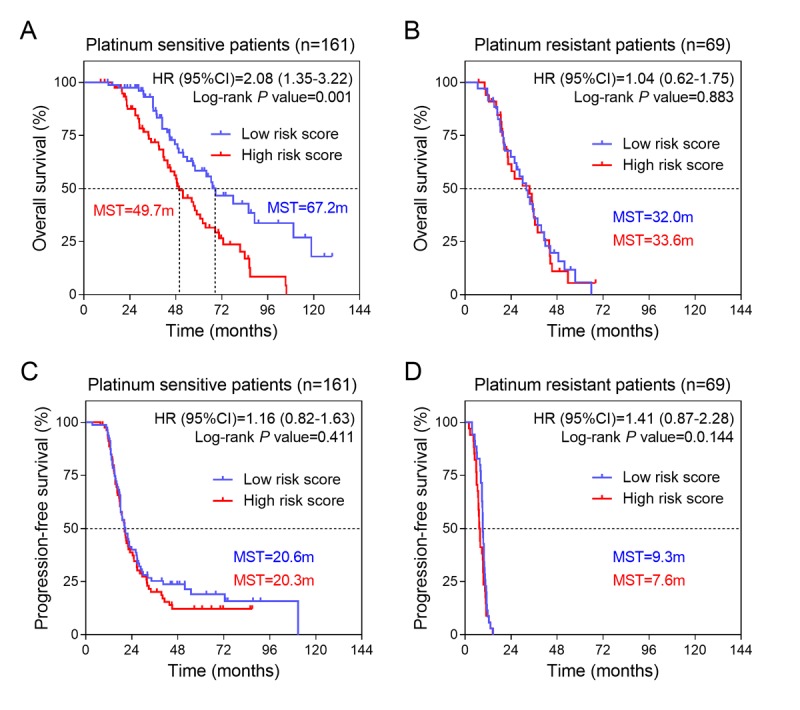
Kaplan-Meier estimates of the survival of patients with different platinum response in training group. (A) Kaplan-Meier survival curves were plotted to estimate the overall survival for platinum sensitive patients in validation group (n=161). (B) Kaplan-Meier survival curves were plotted to estimate the overall survival for platinum resistant patients in validation group (n=69). Progression-free survival was estimated by Kaplan-Meier curves for (C) platinum sensitive and (D) platinum resistant patients in training group.