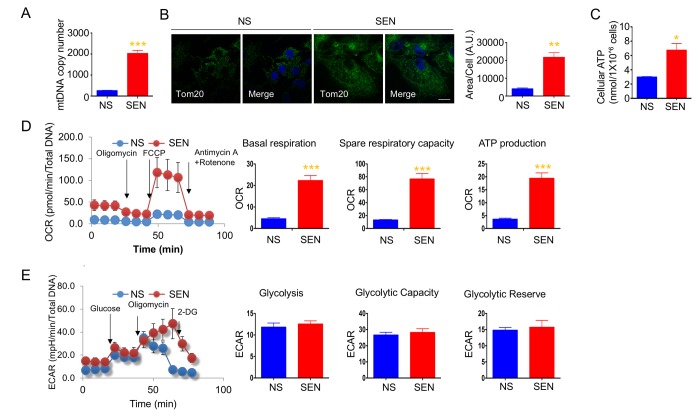
Figure 1.
Mitochondria mass and energetics are altered during doxorubicin-induced senescence. (A) mitochondrial DNA (mtDNA) copy number in non-senescent (quiescent) and senescent cells. (B) Representative images of Tom20 (green; mitochondria) and Hoechst 33258 (blue; nucleus) immunostaining in non-senescent (quiescent) and senescent cells. Scale bar, 20 μm. The area of Tom20 staining per cells were measured using image J. (C) Cellular ATP levels in non-senescent (quiescent) and senescent cells. (D) Cellular oxygen consumption rate (OCR) in non-senescent and senescent cells. The basal respiration, spare respiratory capacity, and ATP production are calculated based on the sequential compound injection according to the manufacture’s instruction. (E) The extracellular acidification rate (ECAR) in non-senescent (quiescent) and senescent cells. Glycolysis, glycolytic capacity, and glycolytic reserve are calculated based on the sequential compound injection according to the manufacture’s instruction. Data are reported as mean ± SEM of three to eight independent experiments. Significant differences were determined by Student’s t-tests. *p<0.05, ***p<0.001. Abbreviations: NS, Non-senescent cells (quiescent); SEN, Senescent cells.

