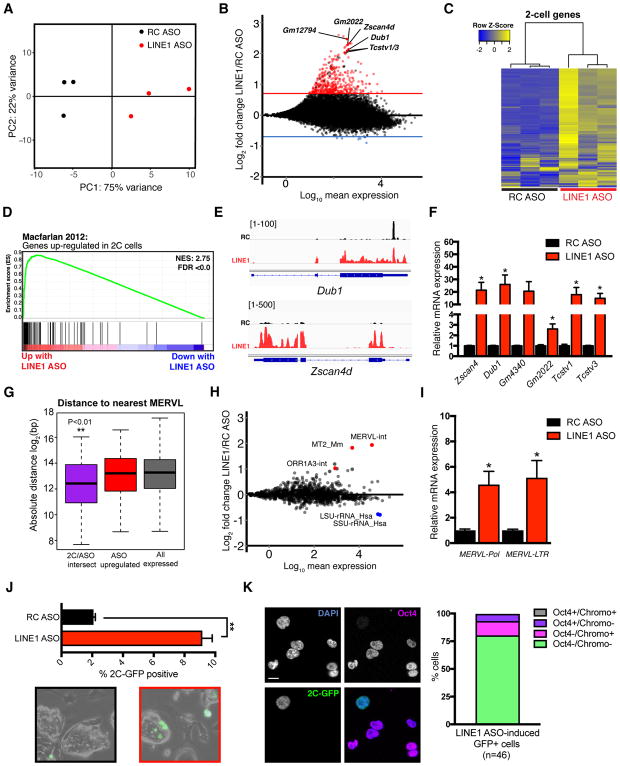
Figure 2. LINE1 knockdown causes upregulation of 2C genes and MERVL.
(A) PCA plot for all genes across all samples, showing that LINE1 KD ES cells have distinct gene expression profiles and are separated from controls along PC1.
(B) MA plot showing log2 fold-changes in the expression of each gene following LINE1 KD. Horizontal red or blue lines indicate FDR <0.05 and log2 fold-chance (FC) of > 0.7 or < −0.7, respectively. Select upregulated 2-cell (2C) genes are labeled in black.
(C) Heatmap showing expression changes of 142 2C genes as defined in (Macfarlan et al., 2012), upon LINE1 KD.
(D) GSEA for 2C genes as in (C) showing a preferential upregulation of nearly all genes upon LINE1 KD.
(E) Browser RNA-seq screenshots of 2C genes Zscan4d and Dub1 in RC or LINE1 ASO samples.
(F) qRT-PCR validation of 2C gene upregulation following LINE1 KD with ASOs. Data are mean +/− s.e.m., n=3 biological replicates.
(G). Distance analysis performed on the indicated sets of genes, calculating of log2 absolute distance in base-pairs (bp) to the nearest MERVL element. 2C/ASO intersect: 52 2C genes from (Macfarlan et al., 2012) also significantly upregulated with LINE KD; ASO upregulated: all significantly upregulated genes upon LINE1 KD. **P < 0.01, two-sided Wilcoxon rank sum test, calculated between 2C/ASO intersect and all expressed genes.
(H) MA plot showing log2 fold-changes in repeat expression following LINE1 KD. Upregulated MERVL repeats, and downregulated rRNA repeats, are indicated.
(I) qRT-PCR validation of MERVL expression following LINE1 KD. Data are mean +/− s.e.m., n=3 biological replicates.
(J) Percentage of 2C-like cells and representative micrographs in 2C-GFP reporter ES cells 48h after nucleofection with ASOs. Data are mean +/− s.e.m of 2 independent experiments.
(K) Immunofluorescence analysis of LINE1 KD-induced 2C-like cells. Graph depicts the percentage of GFP+ cells that have the expected features (loss of chromocenters and Oct4 protein). Scale bar, 10μm, n=number of cells. See also Figure S2 and Table S1.

