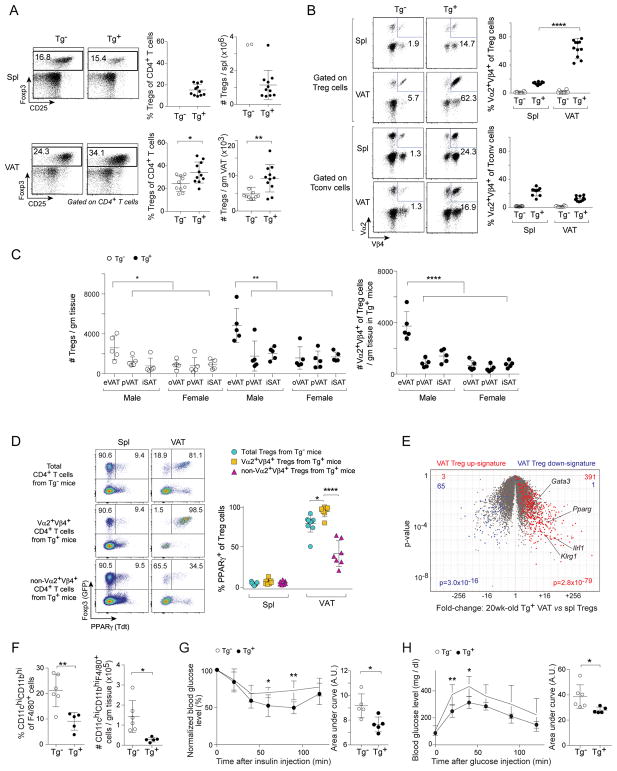
Figure 1. Characterization and validation of the vTreg53 TCR-tg mouse model.
(A, B) Flow cytometric analyses of Treg and Tconv cells from 20wk-old Tg− and Tg+ male mice (n≥10). A) Frequencies and numbers of total Tregs. B) Frequencies of Vα2+Vβ4+ cells.
(C) Numbers of total (left) and Vα2+Vβ4+ (right) Treg cells in various fat depots from 18wk-old Tg− and Tg+ mice (n=5).
(D) PPARγ expression in Tregs from 20wk-old Tg− and Tg+ Pparg-TdtKI/+Foxp3-GFPKI/y male mice (n≥7).
(E) Volcano plot comparing gene expression of Vα2hiVβ4hi VAT and splenic Tregs from 20wk-old Tg+ Foxp3-GFPKI/y male mice (n=3). VAT Treg signature genes (Cipolletta et al., 2015) are highlighted in red (induced) or blue (repressed). The number of genes from each signature preferentially expressed by one or the other population are shown at the top.
(F) Frequencies (left) and numbers (right) of inflammatory macrophages from 14–16wk-old Tg− and Tg+ male mice (n≥5). Exemplar dot-plots appear in Fig. S2E.
(G, H) Metabolic indices for 14–16wk-old Tg− and Tg+ male mice (n≥5). G) Intraperitoneal insulin-tolerance test (ITT). H) Intraperitoneal glucose-tolerance test (GTT). Data represent two independent experiments.
Summary plots show data pooled from two to four independent experiments. Mean ±SD. Spl, spleen; VAT, visceral adipose tissue; eVAT, epididymal VAT; pVAT, peri-renal VAT; oVAT, ovarian VAT; iSAT, inguinal subcutaneous adipose tissue; Tdt, Td-tomato; AU, arbitrary units. See also Fig. S1, S2 and Table S1.

