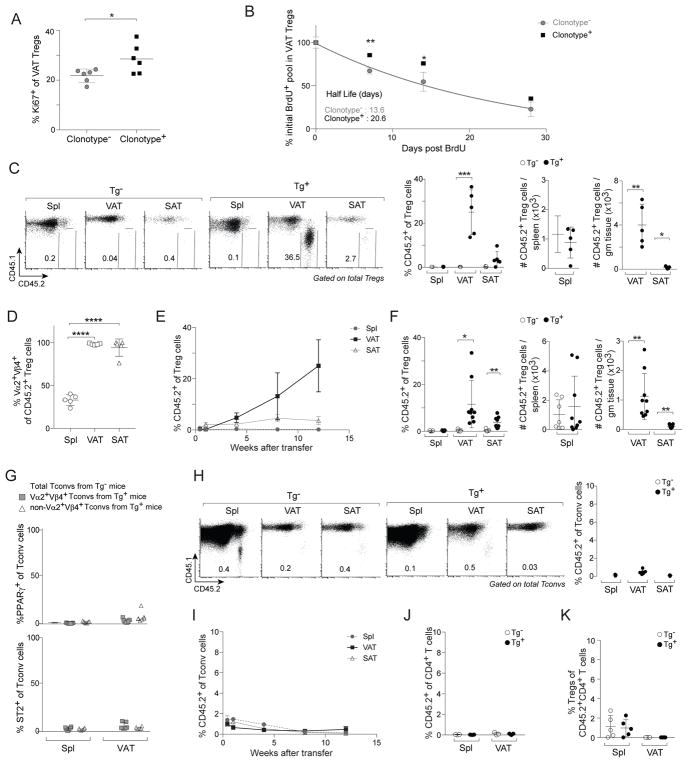
Figure 2. TCR specificity was a critical driver of VAT Treg accumulation.
(A, B) Proliferation and decay rate of clonotype− (non-Vα2+Vβ4+) and clonotype+ (Vα2+Vβ4+) VAT Treg cells. A) Frequencies of Ki67+ VAT Treg cells from 10wk-old Tg+ male mice (n=6). Data for Vα2+Vβ4+ VAT Tregs also appear in Fig. 3E. B) 10wk-old Tg+ male mice were given BrdU in the drinking water for 4 weeks, and BrdU+ VAT Treg cells were detected at various time points after drug removal (n≥3).
(C–E) CD4+ T cells from pooled spleen and LNs of Tg− or Tg+ CD45.2+ male mice were iv-transferred into B6.CD45.1+ male mice. C) Frequencies and numbers of CD45.2+ Treg cells at 12wks after transfer (n=5). D) Frequencies of Vα2+Vβ4+ cells in CD45.2+ TCR-tg Treg cells at 12wks after transfer (n=5). E) Time course analysis following transfer of TCR-tg CD4+ T cells (n=5).
(F) Treg cells sorted from Tg− and Tg+ CD45.2+ Foxp3-GFPKI/y male mice were transferred into B6.CD45.1+ male mice. Frequencies and numbers of CD45.2+ Treg cells at 12wks after transfer (n≥7).
(G) PPARγ (above) and ST2 (below) expression in Tconv cells from 20wk-old Tg− and Tg+ Pparg-TdtKI/+Foxp3-GFPKI/y male mice (n≥6).
(H, I) Experimental set-up as per panels C–E. H) Frequencies of CD45.2+ cells in Tconv cells at 12wks after transfer (n=5). I) Time course analysis following transfer of TCR-tg CD4+ T cells (n=5).
(J, K) Tconv cells sorted from Tg− and Tg+ CD45.2+ Foxp3-GFPKI/y male mice were transferred into B6.CD45.1+ male mice. J) Frequencies of CD45.2+ cells in CD4+ T cells at 12wks after transfer (n=5). K) Frequencies of Treg cells converted from CD45.2+ Tconv cells at 12wks after transfer (n=5).
Summary plots show data pooled from two to four independent experiments. Mean ± SD.

