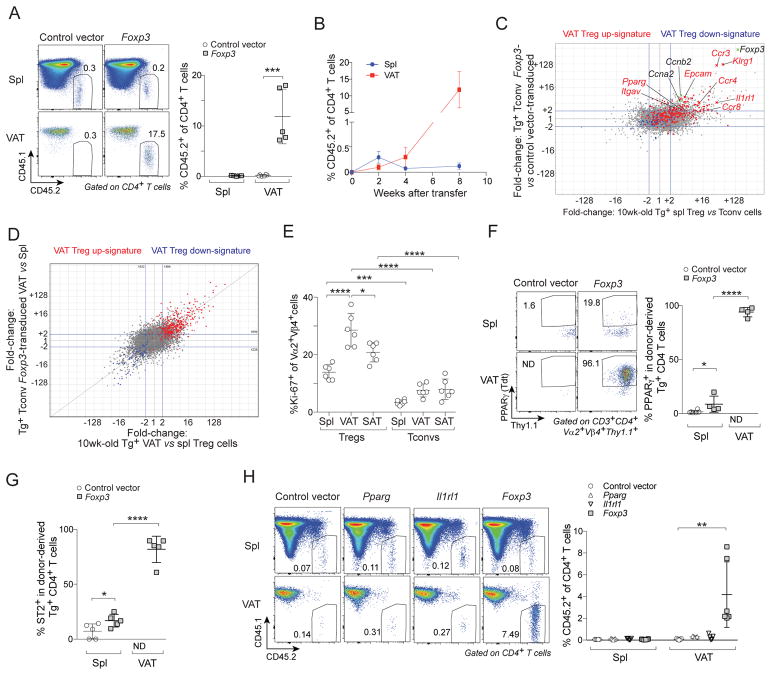
Figure 3. Foxp3 expression was important for accumulation of CD4+ T cells in VAT.
(A–D) Tconv cells from Tg+ CD45.2+ Foxp3-GFPKI/y male mice were transduced with indicated retrovirus and transferred into B6.CD45.1+ male mice. A) Frequencies of CD45.2+ cells in CD4+ T cells at 8wks after transfer (n≥5). B) Time course analysis after transfer of Foxp3-transduced cells (n≥4). C) FC/FC plots comparing gene-expression values in 10wk-old Tg+ Vα2hiVβ4hi splenic Treg vs Tconv cells (x-axis) with Tg+ Vα2hiVβ4hi Tconv cells transduced with a Foxp3-expression vector vs an empty vector control, sorted from spleens of recipient B6.CD45.1 male mice 1wk after transfer (y-axis). D) FC/FC plot comparing gene-expression values in 10wk-old Tg+ Vα2hiVβ4hi VAT vs splenic Tregs (x-axis) and Tg+ Vα2hiVβ4hi Foxp3-transduced Tconv cells sorted from VAT vs spleens of recipient B6.CD45.1 male mice 6wks after transfer. VAT Treg signature genes are highlighted in red (induced) or blue (repressed).
(E) Frequencies of Ki67+ cells in 10wk-old Tg+ mice (n=6). Data for Vα2+Vβ4+ VAT Tregs were also shown in Fig. 2A.
(F) PPARγ− Tconv cells from Tg+ CD45.2+ Pparg-TdtKI/+Foxp3-GFPKI/y male mice were transduced and transferred as in panel A. Frequencies of PPARγ(Tdt)+ cells at 8wks after transfer (n≥4).
(G) Experimental set-up as per panel A. Frequencies of ST2+ cells at 8wks after transfer (n=5).
(H) Experimental set-up as per panel A except that cells were transduced with different retrovirus as indicated. Frequencies of CD45.2+ cells in CD4+ T cells at 8wks after transfer (n≥5).
Summary plots show data pooled from two to four independent experiments. Mean ± SD. ND, not detectable.

