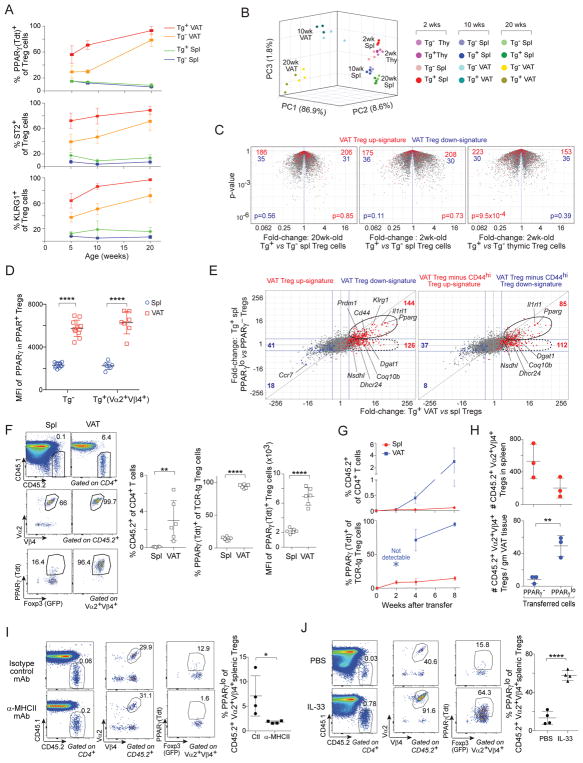
Figure 5. The VAT Treg phenotype was acquired in two stages.
(A) Frequencies of PPARγ+, ST2+, and KLRG1+ cells in Treg cells from Tg− (total Tregs) or Tg+ (Vα2+Vβ4+ Tregs) male mice across various ages (n≥5).
(B) PCA of transcriptomes of Treg cells from various tissues of Tg− (total Tregs) or Tg+ (Vα2hiVβ4hi Tregs) Foxp3-GFPKI/y mice across various ages (n=3).
(C) Volcano plots comparing transcriptomes of Treg cells from Tg− (total Tregs) or Tg+ (Vα2hiVβ4hi Tregs) Foxp3-GFPKI/y male mice across various ages (n=3).
(D) Mean fluorescence intensity (MFI) of PPARγ(Tdt)+ Treg cells from 20wk-old Tg− (total Tregs) or Tg+ (Vα2+Vβ4+ Tregs) Pparg-TdtKI/+ Foxp3-GFPKI/y male mice (n≥7).
(E) FC/FC plots of gene-expression values for Treg cells from 8–10wk-old mice: Tg+ Vα2hiVβ4hi VAT Tregs vs splenic Tregs (x-axis) compared with Tg+ Vα2hiVβ4hi PPARγlo vs PPARγ− splenic Tregs (y-axis) (n=4). VAT Treg signature genes (Left) or those minus CD44hi Treg signature genes (Right) highlighted in red (induced) or blue (repressed). Numbers on the side represent the number of corresponding signature genes induced (right) or repressed (left) in VAT Tregs changed (top and bottom) or not changed (middle) by more than two-fold in PPARγlo compared with PPARγ− splenic Treg cells.
(F, G) 4×10⁵ PPARγ(Tdt)− Tregs from Tg+ CD45.2+ Pparg-TdtKI/+ Foxp3-GFPKI/y male mice were transferred into B6.CD45.1+ male mice. F) Frequencies of CD45.2+ CD4+ T cells and PPARγ(Tdt)+ cells, and MFI of PPARγ(Tdt)+ Treg cells at 8wks after transfer (n=6). G) Time-course analysis (n≥5).
(H) 5×10⁴ PPARγ(Tdt)− or PPARγ(Tdt)+ Treg cells from Tg+ CD45.2+ Pparg-TdtKI/+ Foxp3-GFPKI/y male mice were transferred into B6.CD45.1+ male mice. Numbers of CD45.2+ Vα2+Vβ4+ Treg cells at 4wks after transfer (n=3).
(I, J) 4×10⁵ PPARγ(Tdt)− Tregs were transferred as per panel (F). I) Recipient mice were iv-injected with isotype control or α-MHCII mAb every 3 days for 2wks. J) Recipient mice were i.p.-injected with PBS or IL-33 every 3 days for 2wks. Frequencies of PPARγ(Tdt)+ in donor-derived Tg+ cells from spleen at 2wks after transfer.
Summary plots show data pooled from two to three independent experiments. Mean ± SD. PCA, principal component analysis. See also Fig. S4.

