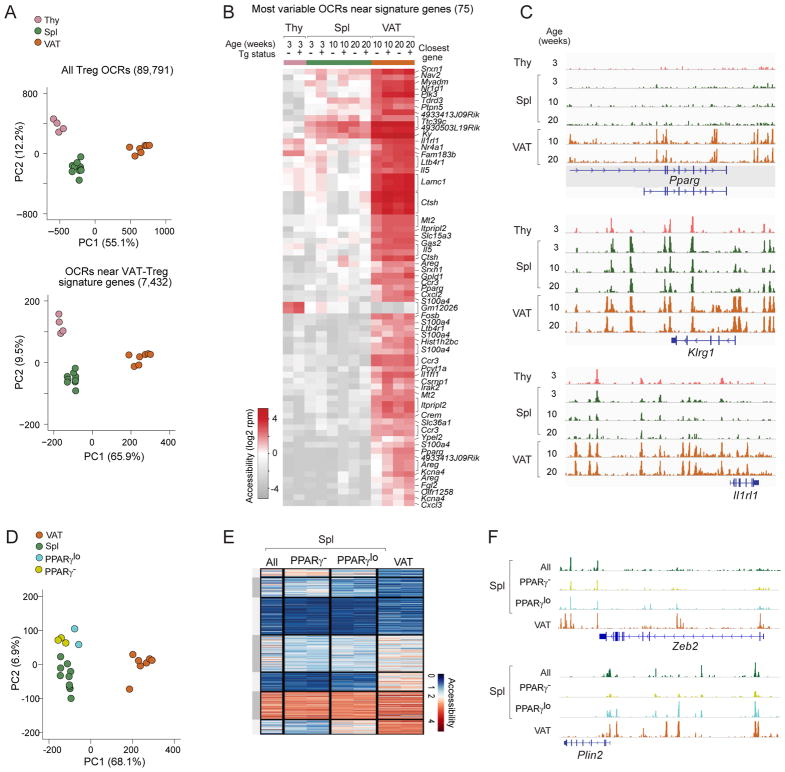
Figure 7. Finalization of the VAT-Treg open chromatin landscape in the adipose tissue.
(A–C) ATAC-seq analysis of thymic, splenic, and VAT Treg cells from Tg− (total Tregs) or Tg+ (Vα2hiVβ4hi Tregs) Foxp3-GFPKI/y male mice. OCR, open-chromatin region. A) Above: PCA using all Treg OCRs. Below: PCA using OCRs ±100Kb of the transcriptional start-site of VAT Treg up-signature genes. B) Chromatin accessibility of the 75 most variable OCRs associated with VAT-Treg up-signature genes. Each column represents an OCR, with its closest gene annotated.. C) Genome-browser tracks of Tg+ Treg ATAC-seq reads at three paradigmatic VAT Treg signature genes.
(D–F) ATAC-seq analysis of PPARγ− and PPARγlo Vα2hiVβ4hi splenic Treg cells from Tg+ male mice. D) PCA using OCRs ±100Kb of the transcriptional start-site of VAT Treg up-signature genes. E) Heat-map of seven variable clusters (delineated by k-means clustering) of Tg+ Treg cells from 8–10wk-old male mice, based on OCRs ±100Kb of the transcriptional start-site of VAT Treg-unique up-signature genes. F) Genome-browser tracks of Tg+ Treg ATAC-seq reads at Zeb2 and Plin2 loci. See also Fig. S5.

