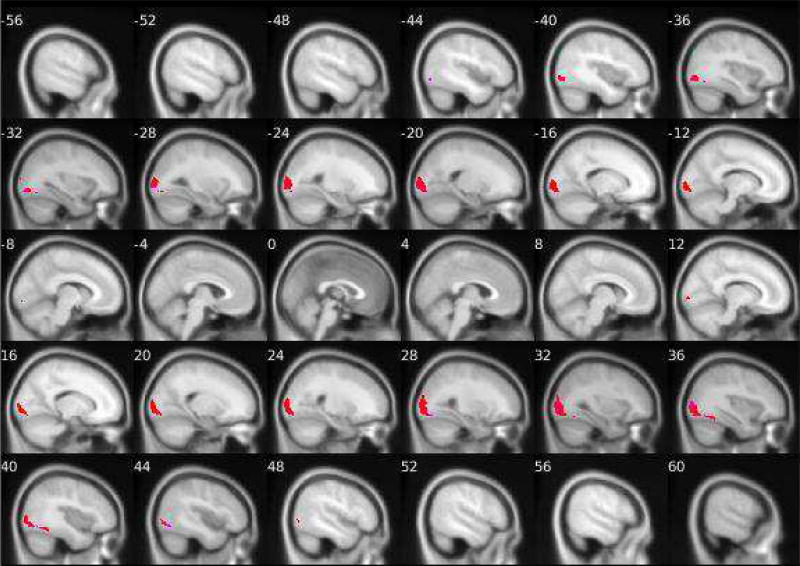
Figure 2. Group-level PPI effects of left and right amygdala connectivity while looking at angry facial expressions versus shapes.
N = 167. Positive connectivity group-level PPI effects of the right amygdala are shown in red and of the left amygdala are shown in pink. Negative connectivity group-level PPI effects of the right amygdala are shown in dark blue of the left amygdala are shown in light blue/turquoise. Details about the target regions (e.g., MNI coordinates, cluster size and extent) are reported in Tables 1 and 2. The fMRI task paradigm is pictured in Supplemental Material S2

