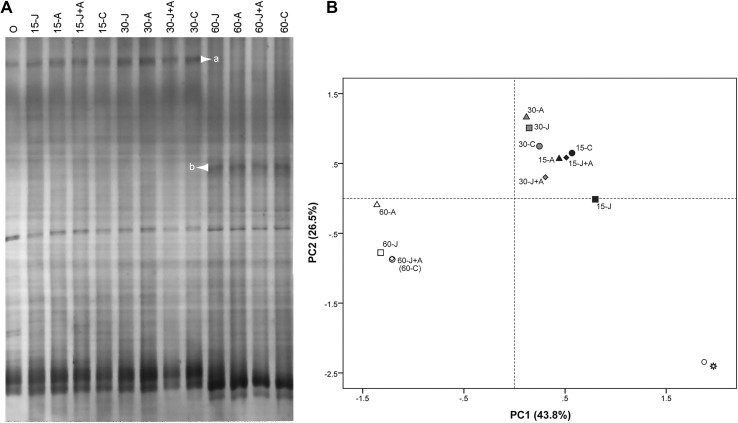
Fig. 5.
DGGE profile (a) and PCA analysis (b) of bacterial 16S rRNA fragments. O represents soil samples taken during transplantation before inoculation; results for 15, 30, and 60 day post-inoculation are shown. J, A, J + A, and C are Jdm1, avermectins, Jdm1 + avermectins, and control (water) treatments, respectively

