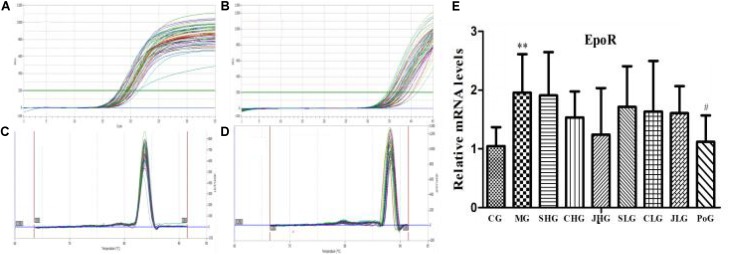
FIGURE 3.
The mRNA expression of EpoR in hepar. (A) β-actin and (B) Epo are PCR amplification curve. (C) β-actin and (D) Epo are dissociation curve. (E) The relative mRNA levels of EpoR. CG, control group, MG, model group, SHG, Curcumae Longae Radix group, CHG, Stir-frying Curcumae Longae Radix with vinegar group, JHG, Stir-frying Curcumae Longae Radix with wine group, SLG, Curcuma phaeocaulis Radix group, CLG, Stir-frying Curcuma phaeocaulis Radix with vinegar group, JLG, Stir-frying Curcuma phaeocaulis Radix with wine group and PoG, positive group. Values were mean ± SD (n = 6). ∗∗p < 0.01 vs. control group; #p < 0.05 vs. model group.

