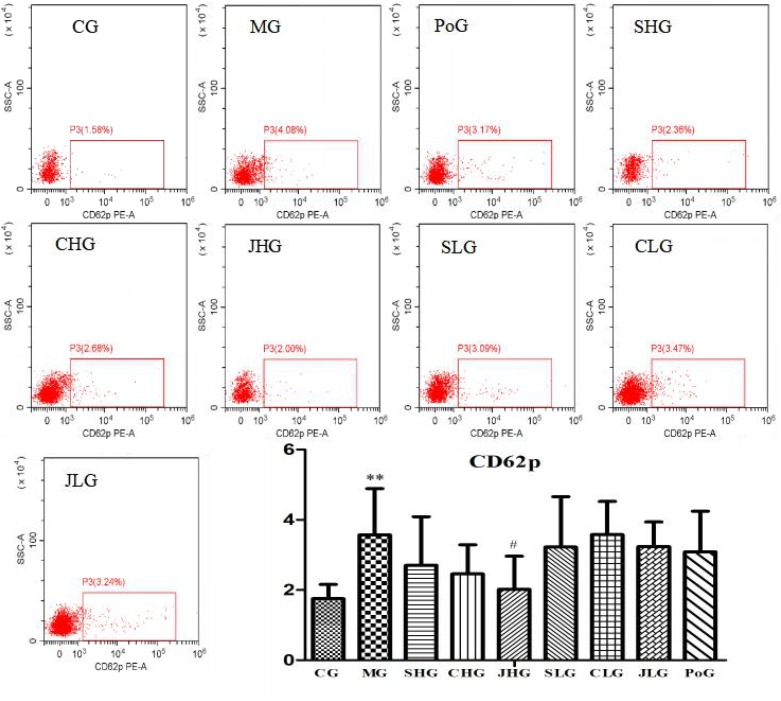
FIGURE 5.
CD62p analysis using flow cytometry assay. CG, MG, PoG, SHG, CHG, JHG, SLG, CLG and JLG are images for the flow cytometry analysis of apoptosis in different groups. CG, control group, MG, model group, SHG, Curcumae Longae Radix group, CHG, Stir-frying Curcumae Longae Radix with vinegar group, JHG, Stir-frying Curcumae Longae Radix with wine group, SLG, Curcuma phaeocaulis Radix group, CLG, Stir-frying Curcuma phaeocaulis Radix with vinegar group, JLG, Stir-frying Curcuma phaeocaulis Radix with wine group and PoG, positive group. Values were mean ± SD (n = 6). ∗p < 0.05 and ∗∗p < 0.01 vs. control group; #p < 0.05 vs. model group.

