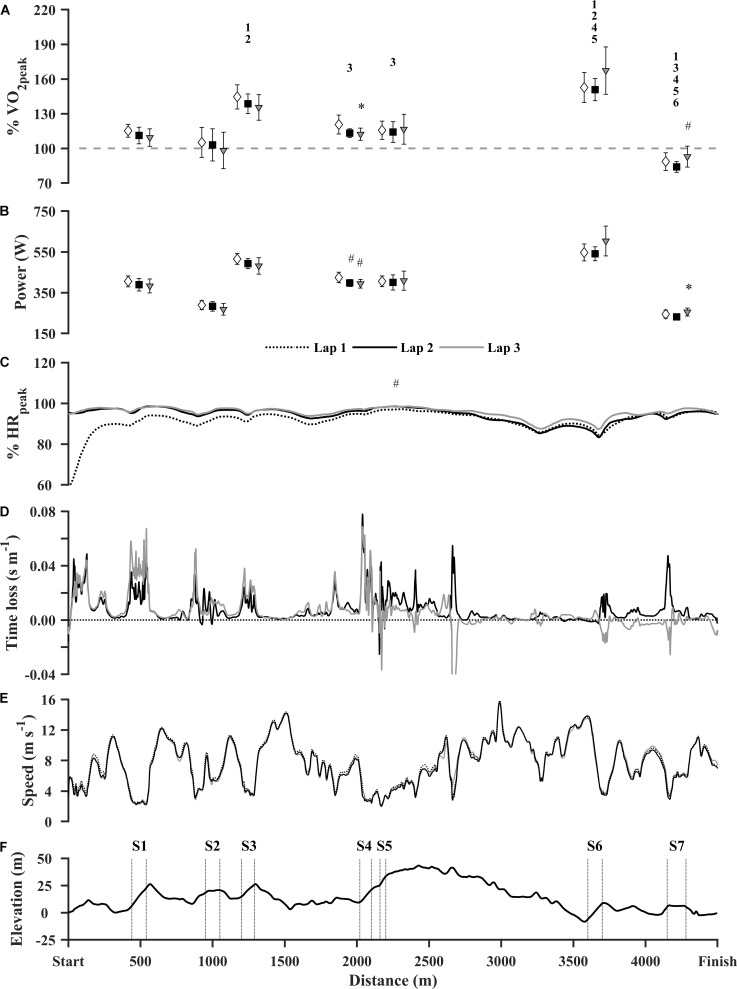
FIGURE 3.
Physiological and performance characteristics from the 13.5 km time trial. (A) Section O2-demands (%VO2peak), (B) external power (W), (C) continuous HR (b⋅min-1), (D) time loss compared to lap 1 (s⋅m-1), (E) speed (m⋅s-1) and (F) course profile. Due to challenging conditions at ∼2700 m the GNSS-solution were poor. Hence, the spikes in time loss does not represent the real difference. Exercise intensity and external power are presented as mean ± 95% confidence intervals. Open diamond: lap 1. Closed square: Lap 2. Gray triangle: lap 3. Numbers indicate a significant difference (p < 0.05) in average section O2-demand across the 3 laps from the section with the corresponding number. #Significantly different from lap 1. ∗Significantly different from lap 2. (n = 7).

