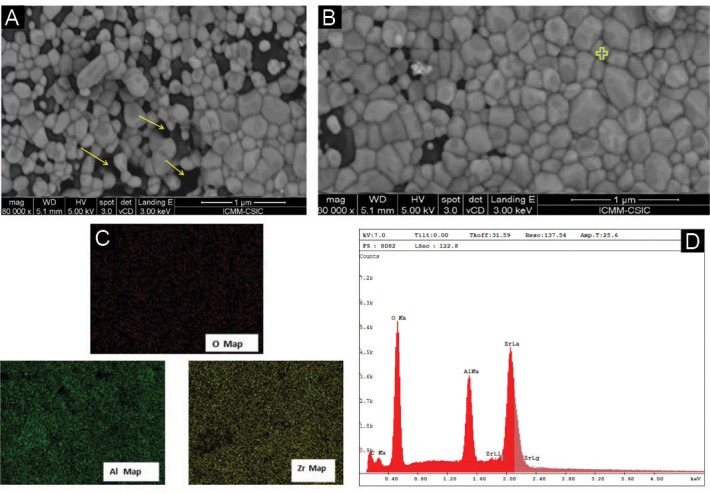
Figure 3.

(A) The FESEM image from A-3Y-TZP20 nanocomposite. (B) The FESEM image from A-3Y-TZP20 nanocomposite sintered at 1270°C. (C) EDAX analysis of A-3Y-TZP20 nanocomposite sintered at 1270°C. (D) X- ray mapping from A-3Y-TZP20 nanocomposite sintered at 1270°C.
