Figure 3.
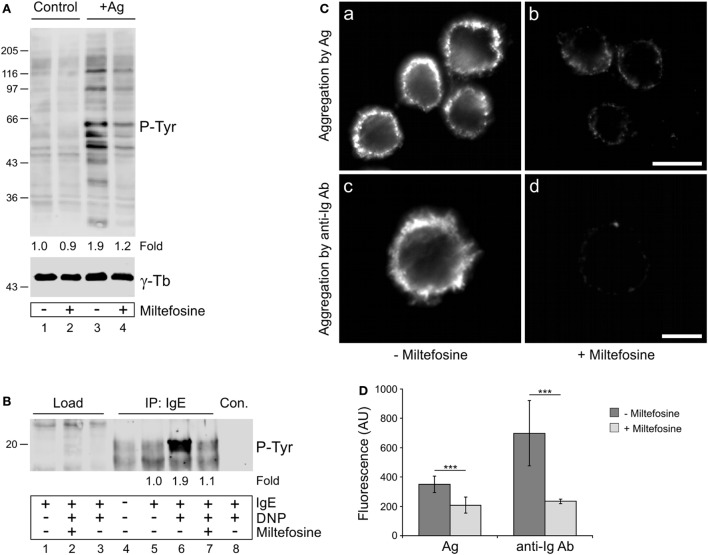
Miltefosine affects tyrosine phosphorylation and aggregation of high affinity IgE receptors (FcεRIs) in activated bone marrow-derived mast cells (BMMCs). (A) Comparison of protein tyrosine phosphorylation level (P-Tyr) in control cells and cells activated by FcεRI aggregation (+Ag) in the absence (lanes 1 and 3) or presence (lanes 2 and 4) of miltefosine. γ-Tubulin (γ-Tb) served as a loading control. Representative image out of three repetitions is shown. Numbers under the blot indicate relative amounts of P-Tyr normalized to control cells and to the amount of γ-tubulin in individual samples (fold). (B) Comparison of FcεRI receptor phosphorylation (P-Tyr) in the absence (lanes 1, 3–6, and 8) or presence (lanes 2 and 7) of miltefosine. Cells sensitized with mouse IgE to Ag were incubated with or without miltefosine, activated or not by Ag (DNP), and extracts were precipitated with anti-IgE Ab immobilized on protein A beads. In the control, protein A without Ab was incubated with the cell extract (lane 8, Con.). Note the difference in signal intensities in the positions of co-precipitated FcεRI receptors when cells were incubated without (lane 6) or with (lane 7) miltefosine. Representative image out of three repetitions is shown. Numbers under the blot indicate relative amounts of P-Tyr normalized to sensitized cells (fold). (A,B) Bars on the left indicate positions of molecular weight markers in kDa. (C) Comparison of FcεRI aggregation in the absence or presence of miltefosine. Cells sensitized with mouse IgE to Ag were incubated without (a,c) or with (b,d) miltefosine and activated by crosslinking of bound IgE with Ag (a,b; aggregation by Ag) or with anti-mouse Ig Ab conjugated with DY549 (c,d; aggregation by anti-Ig Ab). Cells were fixed with formaldehyde, and in the case of Ag-activated cells (a,b), stained with anti-mouse Ab conjugated with DY549. Images (a,b) and (c,d) were collected and processed under identical conditions. Scale bars, 10 µm (a,b); 5 µm (c,d). (D) Analysis of fluorescence intensity of FcεRI aggregation in the absence or presence of miltefosine. BMMCs were activated by crosslinking of bound IgE with Ag (Ag) or with anti-mouse Ig Ab (anti-Ig Ab). Values indicate mean ± SD (Ag, n = 30; anti-Ig Ab, n = 5); ***p < 0.001.

