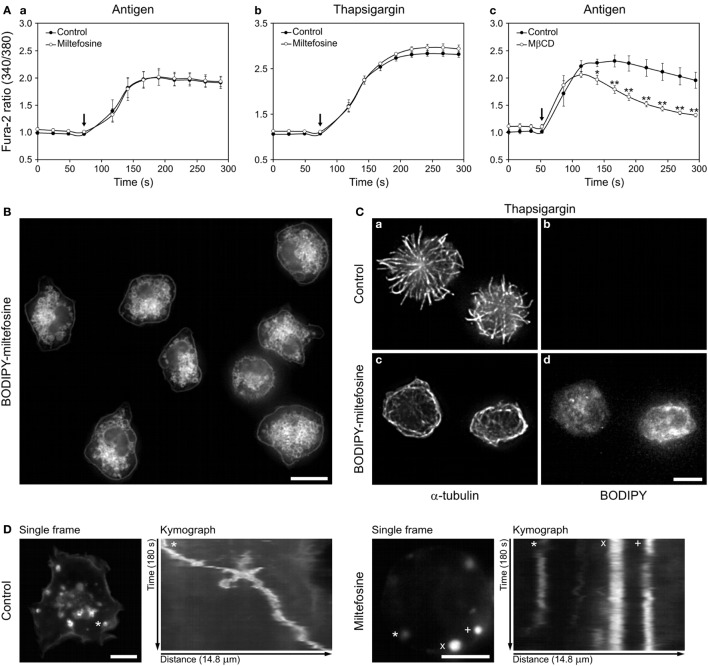
Figure 4.
Miltefosine does not inhibit Ca2+ influx in activated bone marrow-derived mast cells (BMMCs), but localizes to cellular membranes and inhibits the granule movement. (A) Effect of miltefosine (a,b) and methyl-β-cyclodextrin (MβCD) (c) on intracellular Ca2+ level during cell activation. Sensitized cells were loaded with Fura-2-acetoxymethyl ester and pre-treated with or without (Control) miltefosine or MβCD. IgE-sensitized cells were activated by high affinity IgE receptor aggregation with Ag (a,c) or with thapsigargin (b). Arrows indicate addition of Ag or thapsigargin. Data represent mean ± SE [n = 3 for (a,b); n = 4 for (c)] from independent experiments performed in duplicates; *p < 0.05 and **p < 0.01. (B) BODIPY-miltefosine localizes to the cellular membranes and cytosol. Live-cell imaging of cells incubated with BODIPY-miltefosine. Scale bar, 10 µm. (C) BODIPY-miltefosine inhibits microtubule reorganization in activated cells. BMMCs treated or untreated (control) with BODIPY-miltefosine were activated by thapsigargin, fixed and stained for α-tubulin (a,c). Staining of BODIPY (b,d). Images (b,d) were collected and processed under identical conditions. Scale bar, 5 µm (a–d). (D) Time-lapse imaging of wheat germ agglutinin-stained intracellular granules in control and miltefosine-treated BMMCs. First frames from 180s time-lapse imaging and kymographs of stained granules are shown. The same track length (14.8 µm) was used for analysis in both cases. The tracked granules are marked by asterisks, cross, and diagonal cross.

