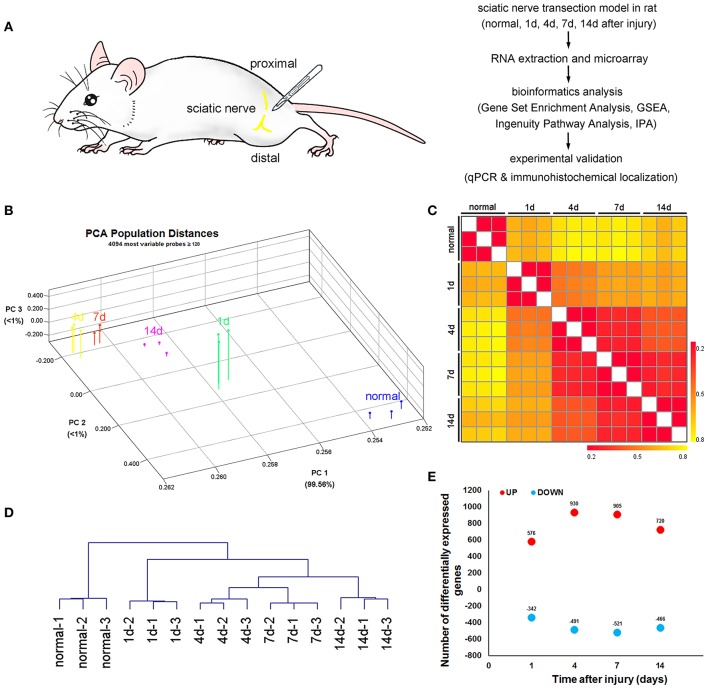
Figure 1.
Bird's-eye view of transcriptome changes of the proximal nerve stump after sciatic nerve transection. (A) Schematic representation of the experimental paradigm used to uncover the transcriptional program induced by sciatic nerve transection. (B) Principal Component Analysis, (C) heatmap of Euclidian distances and (D) hierarchical clustering between indicated populations, calculated using the 10% of probes with the greatest difference in expression among these subsets and with expression values over 128 for at least one of the subsets. Expression values were log2-transformed and row-standardized prior to the analysis. (E) Number of probes upregulated (red symbols) or downregulated (blue symbols) by 2-fold or more at the indicated transitions after sciatic nerve transection.

