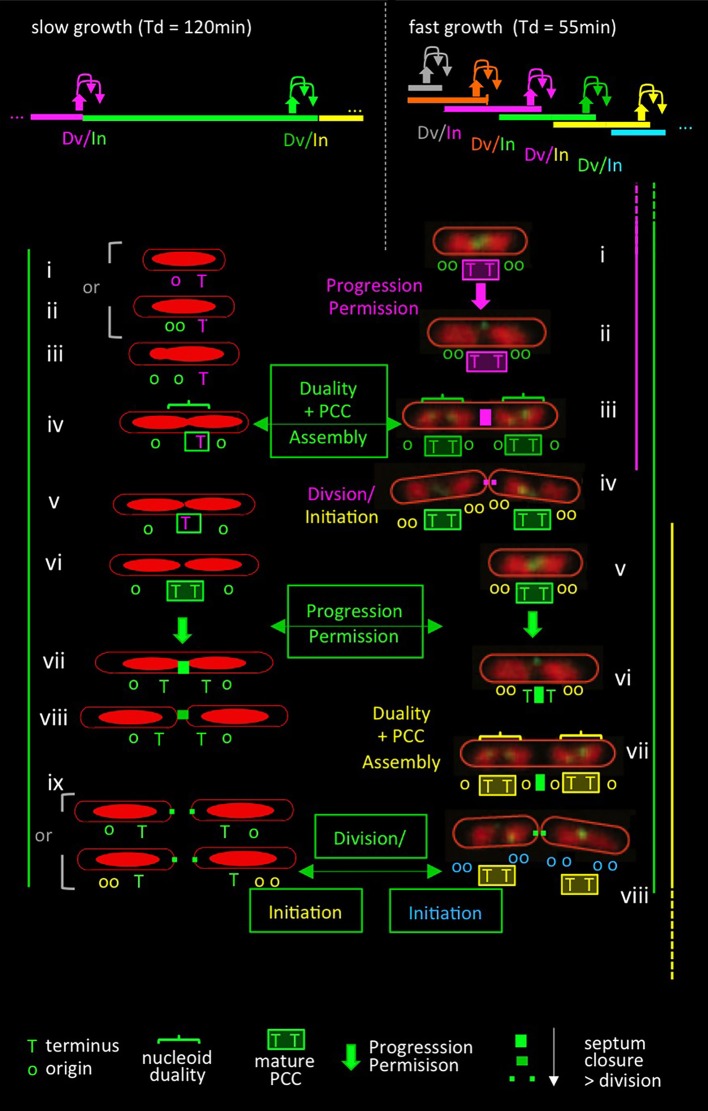
Figure 4.
Comparison of events in slow and fast growth conditions in the context of the progression permission model. Top: patterns of (C+D) sequences (bar) with corresponding events of coordination control including progression permission (upward filled arrows) and the corresponding permitted cell division and replication initiation events (downward arrows). Slow growth patterns correspond to conditions in Figures 3A–C (Bates and Kleckner, 2005); fast growth patterns correspond to conditions in Figure 2C (Nielsen et al., 2007). Bottom: patterns of events in slow (left) and fast (right) growth conditions. Events are color-coded in relation to the (C+D) period to which they correspond, as defined in the top panel. Bottom left side: patterns of nucleoid morphologies and terminus and origin dynamics observed experimentally in slow growth conditions [(Bates and Kleckner, 2005); Figure 3C] plus predicted events of the proposed progression permission process including PCC assembly, progression permission, and the ensuing permitted division and replication initiation. Note that replication begins after division in the study of Bates and Kleckner (Figure 3) but often begins just before division in a number of other slow growth conditions. Bottom right side: nucleoid and terminus morphologies extracted from live cell time-lapse movies of Youngren et al. (2014) and overlaid with predicted events of the proposed progression permission process as it would occur in the corresponding partially overlapping (C+D) periods. Origin numbers and dispositions predicted from “C+D” patterns (Nielsen et al., 2007) are superimposed. Events in slow and fast growth conditions are directly compared by the (C+D) sequences defined in green boxes, as described in the text. The replication initiations resulting from these sequences are shown at the bottom in green boxes, with origin colors of the corresponding (C+D) sequence. (Note that somewhat different replication timing was inferred by analysis of fluorescent foci of SSB; however, that inference failed to take into account the fact that sister replisomes tend to first cluster and then split, implying that SSB foci are not a reliable indicator of the number of replication forks. Indeed, data inspection shows that pairs of SSB foci tend to emerge at the same time as nucleoid duality, in accord with occurrence by splitting rather than as a reflection of the time of initiation).

