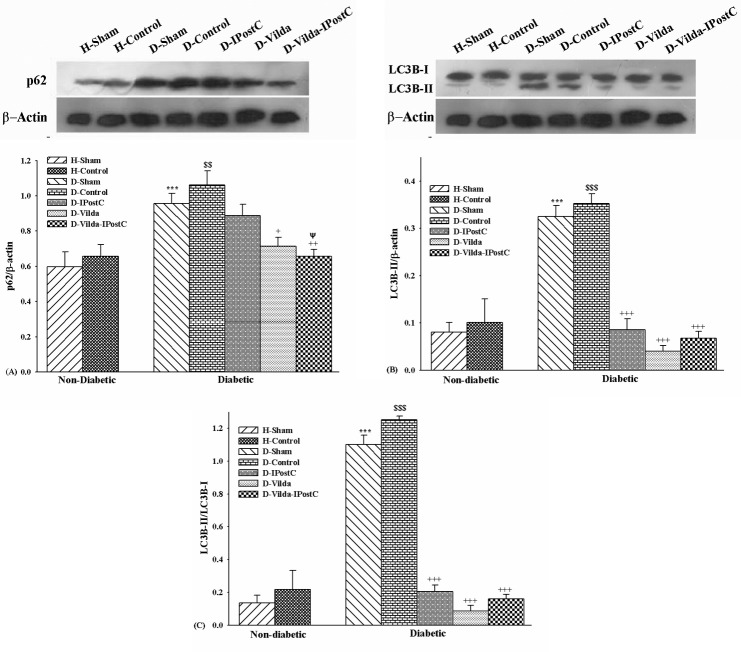
Figure 2.
Changes of autophagy markers in experimental groups. The data were expressed as mean ±SEM. n=5 for each group. A) Changes of p62 protein expression; B) Changes of LC3B-II protein expression; and C) Changes of the ratio of LC3BII/LC3BI. H: healthy; D: diabetic; IPostC: ischemic-postconditioning; Vilda: vildagliptin. Levels of β-actin protein were used as the loading control.$$p<0.01 and $$$p<0.001 as compared with H-Control group;+p<0.05, ++p<0.01 and +++p<0.001 as compared with D-Control group; ΨΨp<0.001 as compared with D-IPostC group.

