
Figure 5.
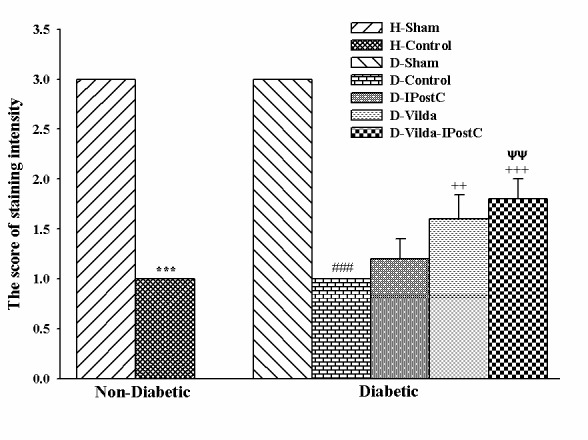
The scoring of staining intensity for determining mitochondrial densities by Cain's method. The data were expressed as mean ± SEM. n=5 for each group. H: Healthy; D: diabetic; IPostC: ischemic postconditioning; Vilda: vildagliptin. ***p<0.001 as compared with H-Sham group; ###p<0.001 as compared with D-Sham group; ++ p<0.001, +++p<0.001 as compared with D-Control group; ΨΨp<0.01 as compared with D-IPostC group.