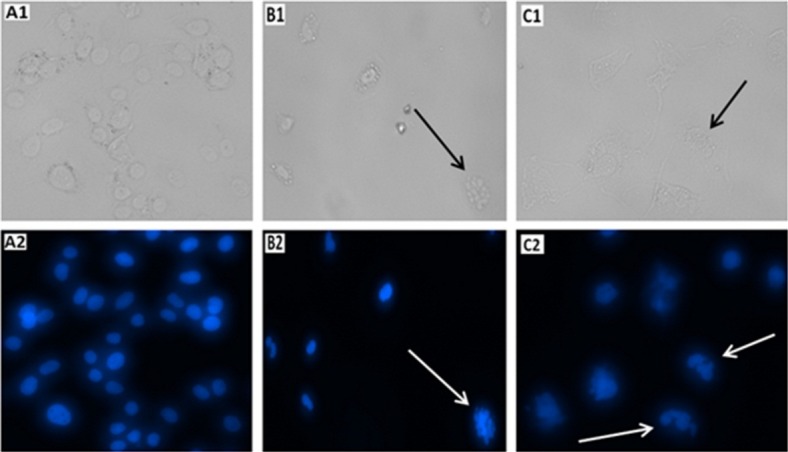
Figure 4.

Light and fluorescence microscopy images of HUVECs stained with DAPI (A1 & A2) Untreated (B1 & B2) Positive control treated by 5% DMSO and (C1 & C2) Ascorbyl Palmitate treated cells (125 μM). The arrows demonstrated chromatin and DNA fragmentation occurrence in positive control cells (treated by 5% DMSO) and AP treated cells.
