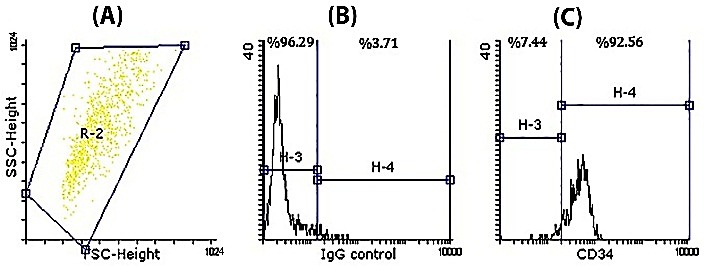
Figure 1.

Flow cytometric analysis of isolated UCB-CD34+ cells. A. Forward versus side scatter (FSC/SSC) dot plot with the gated CD34+ cells in region R-2. B. Negative isotype control (mouse IgG1). C. CD34+ cell populations in region H-4 (purity of isolated UCB-CD34+ cells were %92.56).
