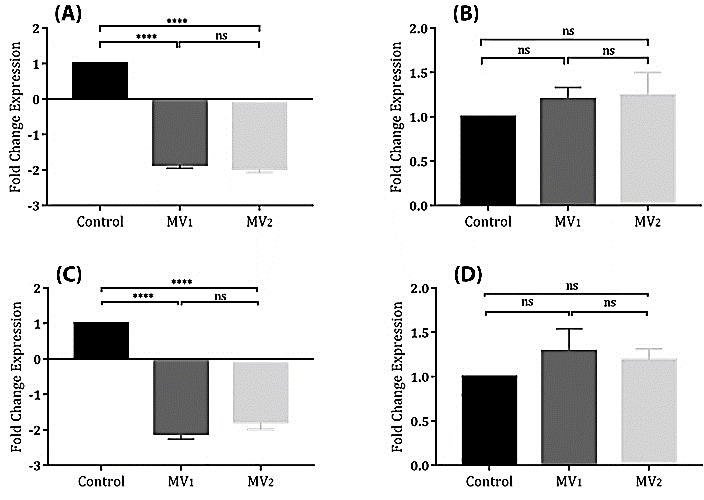
Figure 4.

The relative expression of HBG1 (A), GATA1 (B), FOG1 (C), and NFE2 (D) genes were investigated by Real Time-PCR in three differentiation conditions after 72 hours. GAPDH was used as internal control. HBG1 and FOG1 genes were significantly down-regulated in MV1- and MV2-treated groups in comparison to control group. Upregulation of GATA1 and NFE2 genes were not significant to the control group.
****; Denotes p value <0.0001. ns; non-significant.
