
Figure 5.
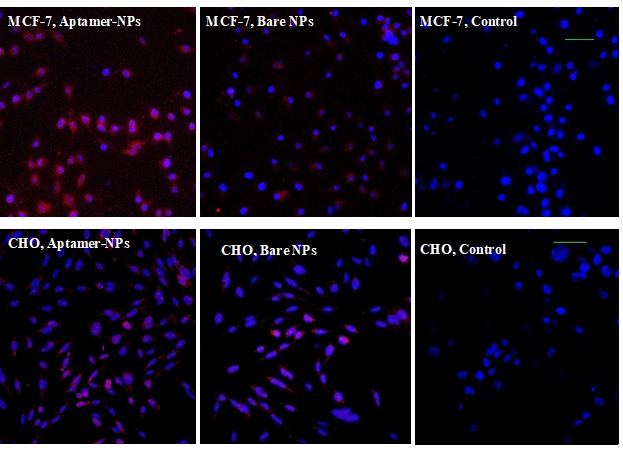
Confocal microscopy images of treated cells (MCF-7 and CHO cell line) with NPs. Lysosomes were marked by LysoTracker Red as an indicator of NP uptake, nuclei stained blue by DAPI. (Scale bars are 50 µm).
Official websites use .gov
A
.gov website belongs to an official
government organization in the United States.
Secure .gov websites use HTTPS
A lock (
) or https:// means you've safely
connected to the .gov website. Share sensitive
information only on official, secure websites.
Confocal microscopy images of treated cells (MCF-7 and CHO cell line) with NPs. Lysosomes were marked by LysoTracker Red as an indicator of NP uptake, nuclei stained blue by DAPI. (Scale bars are 50 µm).