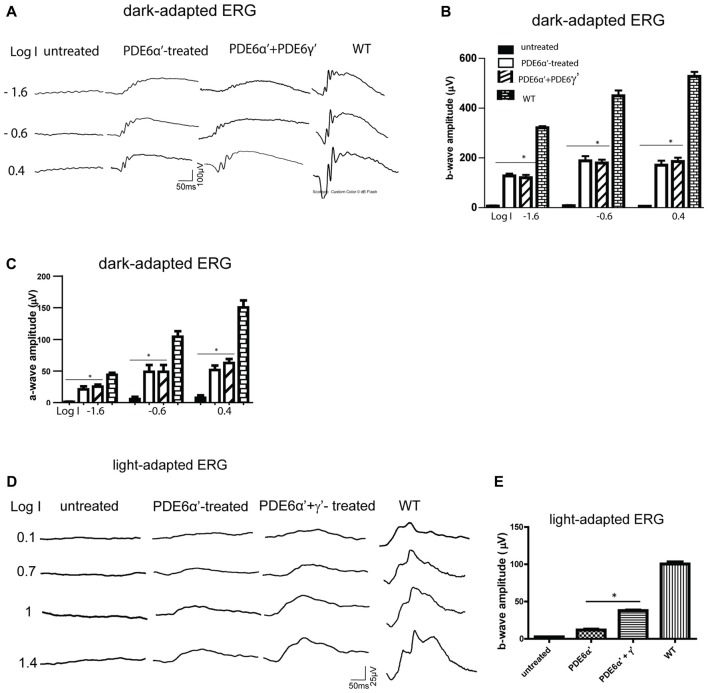
Figure 3.
Scotopic and photopic electroretinogram (ERG) responses in rd10/cpfl1 mice treated with PDE6α’ alone or PDE6α’ and PDE6γ’ together. (A) Representative examples of dark-adapted ERG traces from rd10/cpfl1 mice at 5 weeks following delivery of AAV-smCBA-PDE6α’. (B) Dark-adapted b-wave is partially restored in injected rd10/cpfl1 eyes. One-way ANOVA with the post hoc Bonferroni test demonstrated a significant difference between uninjected and contralateral vector-treated eyes at light intensities of −1.6, −0.6 and 0.4 log cds/m2 (data shown are mean ± SEM, N = 6, *p < 0.001 at all three light intensities, F = 253.0, 134.6 and 212.9 at −1.6, −0.6 and 0.4 log cds/m2, respectively). (C) Dark-adapted a-wave is partially restored in injected rd10/cpfl1 eyes. One-way ANOVA with the post hoc Bonferroni test demonstrated a significant difference between uninjected and contralateral vector-treated eyes (mean ± SEM, N = 6, *p < 0.01 at all three light intensities, F = 28.34, 20.98 and 63.20 at −1.6, −0.6 and 0.4 log cds/m2, respectively). (D) Representative examples of full-field light-adapted ERG traces from rd10/cpfl1 mice at 5 weeks following delivery of AAV-smCBA-PDE6α’ alone or co-injection of AAV-smCBA-PDE6α’ and scAAV-smCBA-PDE6γ’. (E) Photopic b-wave amplitudes are significantly higher in PDE6α’+γ’ co-injected eyes than eyes receiving PDE6α’ alone. The bar graph shows averaged ERG responses from 6 mice at a light intensity of 1.4 log cds/m2 (data shown are mean ± SEM, N = 6, *p < 0.01, F = 580.4).

