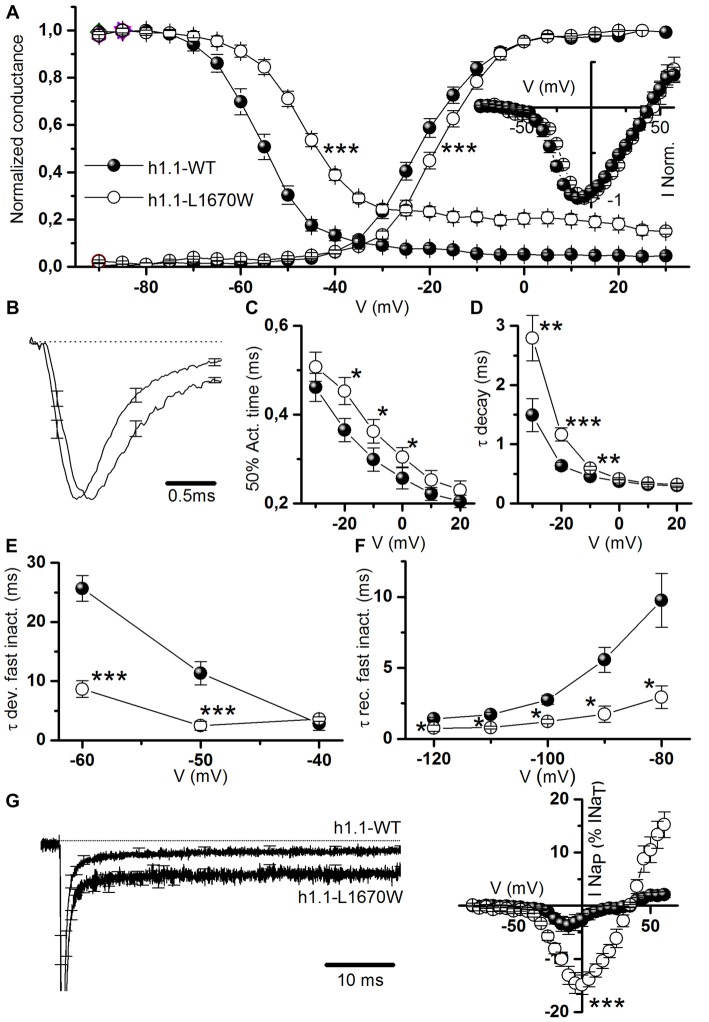
Figure 3.
Functional effects of hNav1.1-L1670W on fast gating properties upon rescue in tsA-201 cells. (A) Mean voltage dependence of activation and fast inactivation, lines are mean Boltzmann fits; mean parameters: voltage of half activation Va and slope Ka for hNav1.1-WT (n = 18), Va = −21.6 ± 1.2 mV, Ka = 6.6 ± 0.4, hNav1.1-L1670W (n = 22), Va = −16.8 ± 1.0 mV (p = 0.004), Ka = 6.1 ± 0.5 mV; voltage of half inactivation (Vh), slope (Kh) and baseline for hNav1.1-WT (n = 12), Vh = −55.6 ± 0.3 mV, Kh = 4.9 ± 0.3 mV, baseline = 0.04 ± 0.01, L1670W (n = 16), Vh = −47.3 ± 0.9 mV (p = 5 * 10−5), Kh = 6.1 ± 0.5 mV, baseline = 0.19 ± 0.05 (p = 2 * 10−5); Welch t-test. Inset: normalized current-voltage (I-V) plot of the peak transient current. (B) Comparison of mean normalized current traces elicited with a command step to −10 mV from a holding potential of −120 mV; the dotted line is the 0. n = 13 for WT and L1679W. (C) Time (ms) of half-activation of the current at the indicated potentials: −30 mV WT 0.46 ± 0.03, L1670W 0.51 ± 0.03; −20 mV WT 0.36 ± 0.03, L1670W 0.45 ± 0.03 (p = 0.02); −10 mV WT 0.29 ± 0.02, L1670W 0.36 ± 0.03 (p = 0.04); 0 mV WT 0.25 ± 0.02, L1670W 0.30 ± 0.02 (p = 0.05); 10 mV WT 0.22 ± 0.01 L1670W 0.25 ± 0.02; 20 mV WT 0.20 ± 0.01 L1670W 0.23 ± 0.02; Welch t-test, n = 13 for all groups. (D) Voltage dependence of the time constant (τ in ms) of the current decay (single exponential fits at the indicated potentials): −30 mV WT 1.5 ± 0.3, L1670W 2.8 ± 0.4 (p = 0.02); −20 mV WT 0.63 ± 0.06, L1670W 1.2 ± 0.1 (p = 5 * 10−4); −10 mV WT 0.45 ± 0.04, L1670W 0.59 ± 0.03 (p = 0.008); 0 mV WT 0.37 ± 0.03, L1670W 0.41 ± 0.02; 10 mV WT 0.31 ± 0.03 L1670W 0.34 ± 0.02; 20 mV WT 0.30 ± 0.03 L1670W 0.32 ± 0.02; Welch t-test, n = 13 for all groups. (E) τ (ms) of the development of fast inactivation at the indicated potentials: −60 mV, τDEV-WT = 25.6 ± 2.2 (n = 12), τDEV-L1670W = 8.6 ± 1.4 (n = 4; p = 0.009); −50 mV, τDEV-WT = 11.3 ± 2.0 (n = 10), τDEV-L1670W = 2.4 ± 0.8 (n = 7; p = 0.002); −40 mV, τDEV-WT = 2.8 ± 1.1 (n = 6), τDEV-L1670W = 3.6 ± 0.4 (n = 7); Mann-Whitney test. (F) τ (ms) of the recovery from fast inactivation at the indicated potentials: −120 mV, τREC-WT = 1.4 ± 0.2 (n = 7), τREC-L1670W = 0.8 ± 0.2 ms (n = 4); −110 mV, τREC-WT = 1.7 ± 0.2 ms (n = 7), τREC-L1670W = 0.79 ± 0.09ms (n = 3; p = 0.02); −100 mV, τREC-WT = 2.7 ± 0.3 ms (n = 8), τREC-L1670W = 1.2 ± 0.2 ms (n = 4; p = 0.014); −90 mV, τREC-WT = 5.6 ± 0.9 ms (n = 7), τREC-L1670W = 1.7 ± 0.6 ms (n = 5; p = 0.02); −80 mV, τREC-WT = 9.8 ± 1.9 ms (n = 7), τREC-L1670W = 2.9 ± 0.8 ms (n = 6; p = 0.02); Mann-Whitney test. (G) Left panel, comparison of the same mean normalized current traces displayed in (B), but with a longer time scale in order to compare INaP; right panel, mean current-voltage plots for INaP measured after 5 min from the establishment of the whole-cell configuration and expressed as percentage of the transient current (maximal INaP: 4.0 ± 1.5% n = 21 WT, 14.9 ± 2.1% n = 22 L1670W; p = 0.002 Mann-Whitney test). Data are shown as mean ± SEM. *p < 0.05, **p < 0.01, ***p < 0.001, ****p < 0.0001.

