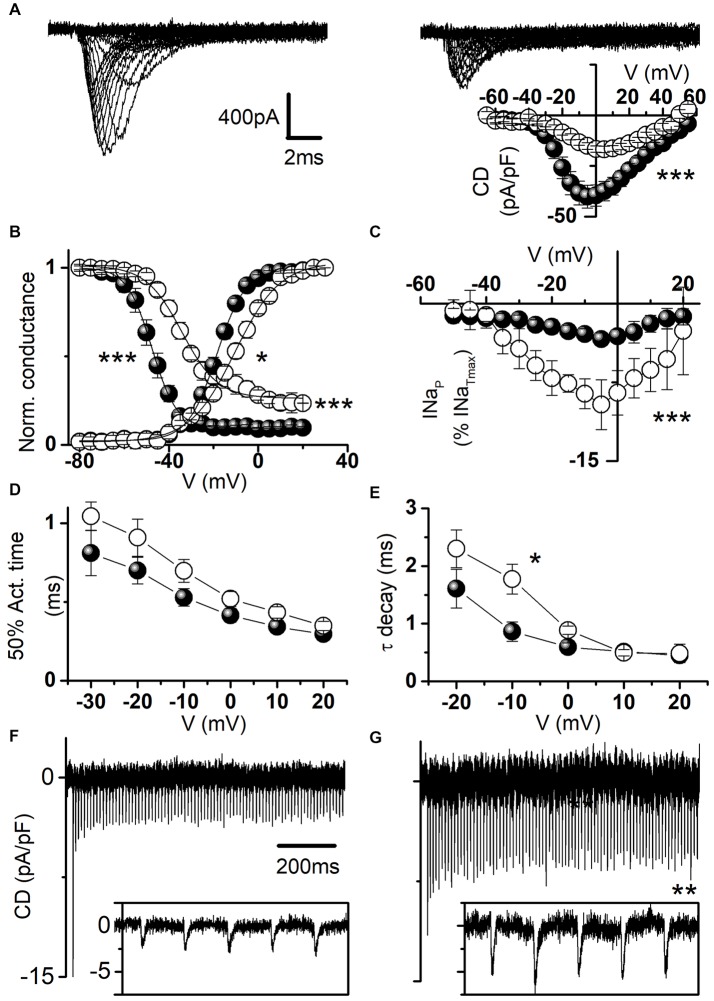
Figure 6.
Functional effects of hNav1.1-L1670W expressed in neocortical GABAergic neurons. (A) Representative whole-cell sodium current traces recorded in the presence of 1 μM tetrodotoxin (TTX) from fusiform bipolar GABAergic neurons selected in primary cultures of neocortical neurons transfected with hNav1.1-F383S-WT (left) or hNav1.1-F383S-L1670W (right); the inset displays the mean current density-voltage plots for hNav1.1-F383S-WT and hNav1.1-F383S-L1670W, and the comparison of the mean maximum current density yielded: WT 41.9 ± 5.7 pA/pF n = 22; L1670W 19.4 ± 1.5 pA/pF n = 20 (p = 7 * 10−4), Mann-Whitney test. (B) Mean voltage dependence of activation and fast inactivation, lines are mean Boltzmann fits; mean parameters: voltage of half activation (Va) and slope (Ka) for WT (n = 16), Va = −17.5 ± 1.3 mV, Ka = 5.1 ± 0.3, L1670W (n = 15), Va = −8.4 ± 1.4 mV (p = 10−4), Ka = 7.7 ± 0.8 mV (p = 0.01); voltage of half inactivation (Vh), slope (Kh) and baseline for WT (n = 15), Vh = −48.1 ± 1.9 mV, Kh = 4.3 ± 0.2 mV, baseline = 0.09 ± 0.03, L1670W (n = 9), Vh = −27.9 ± 1.5 mV (p = 3 * 10−4), Kh = 5.1 ± 0.7 mV, baseline = 0.26 ± 0.06 (p = 5*10−4); Welch t-test. (C) Mean current-voltage plots for INaP measured after 5 min from the establishment of the whole-cell configuration and expressed as percentage of the transient current; comparison of maximal INaP: WT 5.6 ± 0.9% n = 21, L1670W 13.6 ± 1.9% n = 22, p = 0.005, Mann-Whitney test). (D) Time (ms) of half-activation of the current at the indicated potentials: −30 mV WT 0.81 ± 0.14, L1670W 1.05 ± 0.09; −20 mV WT 0.70 ± 0.08, L1670W 0.9 ± 0.1; −10 mV WT 0.53 ± 0.05, L1670W 0.69 ± 0.07; 0 mV WT 0.41 ± 0.04, L1670W 0.52 ± 0.04; 10 mV WT 0.34 ± 0.04 L1670W 0.43 ± 0.03; 20 mV WT 0.29 ± 0.03 L1670W 0.35 ± 0.03; non-significant differences, Welch t-test, n = 15 for all groups. (E) Voltage dependence of the time constant (τ in ms) of the current decay (single exponential fits at the indicated potentials): −20 mV WT 1.6 ± 0.3, L1670W 2.3 ± 0.3; −10 mV WT 0.86 ± 0.18, L1670W 1.77 ± 0.26 (p = 0.02); 0 mV WT 0.59 ± 0.07, L1670W 0.88 ± 0.07; 10 mV WT 0.51 ± 0.06 L1670W 0.49 ± 0.05; 20 mV WT 0.45 ± 0.05 L1670W 0.48 ± 0.16; Welch t-test, n = 15 for all groups. Whole-cell action sodium currents (expressed as mean current density; error bars are not shown for clarity) recorded as in Figures 5D–F using as voltage stimulus an action potential discharge recorded in a neocortical mouse brain slice from a GABAergic fast spiking neuron for WT (n = 11; F) and L1670W (n = 9; G): comparison of the amplitude of the first peak action current in the discharge, WT 19.6 ± 2.9 pA/pF; L1670W 12.7 ± 1.8 pA/pF; the first action current with amplitude statistically different was the 3rd in the discharge: WT 5.9 ± 1.5 pA/pF; L1670W 10.5 ± 1.4 pA/pF (p = 0.048); comparison of the average of the last five peak action currents (pooled) in the discharge, WT 5.2 ± 0.8 pA/pF; L1670W 9.0 ± 1.0% pA/pF (p = 0.01); Welch t-test for all the comparisons. Data are shown as mean ± SEM.

