FIGURE 1.

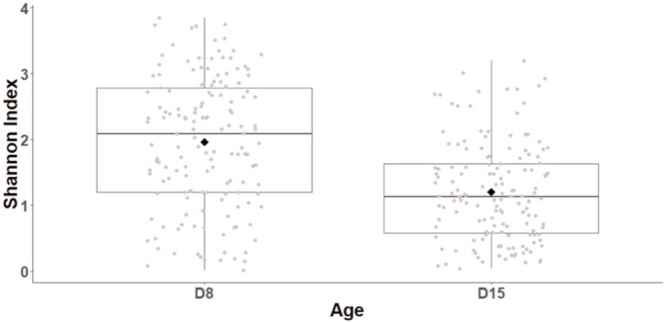
Shannon diversity index of great tits nestling cloacal microbiota at D8 and D15. Median represented by the black line, the mean by the black dot, 25 and 75% quartiles by the lower and upper box and 90% confidence interval by the whiskers.

Shannon diversity index of great tits nestling cloacal microbiota at D8 and D15. Median represented by the black line, the mean by the black dot, 25 and 75% quartiles by the lower and upper box and 90% confidence interval by the whiskers.