
FIGURE 3.
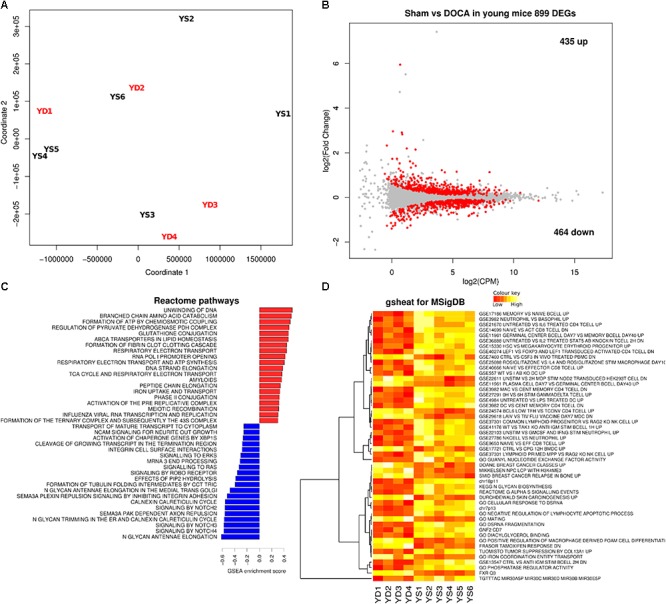
Cardiac transcriptome in young sham vs. DOCA mice. (A) Principal component analyses shows lack of sample group clustering on the first two dimensions for young sham vs. DOCA mice. (B) MA plot showing 899 differentially expressed genes (FDR < 0.05; Supplementary Table S3). Mechanisms differentially regulated between young sham and DOCA mice in the (C) GSEA analysis of Reactome Database and (D) Gsheat analysis of Molecular Signatures Database (MSigDB) (Supplementary Table S4). Sample size: n = 6 young sham vs. n = 4 young DOCA mice. CPM, counts per million; YD, young DOCA; YS, young sham.