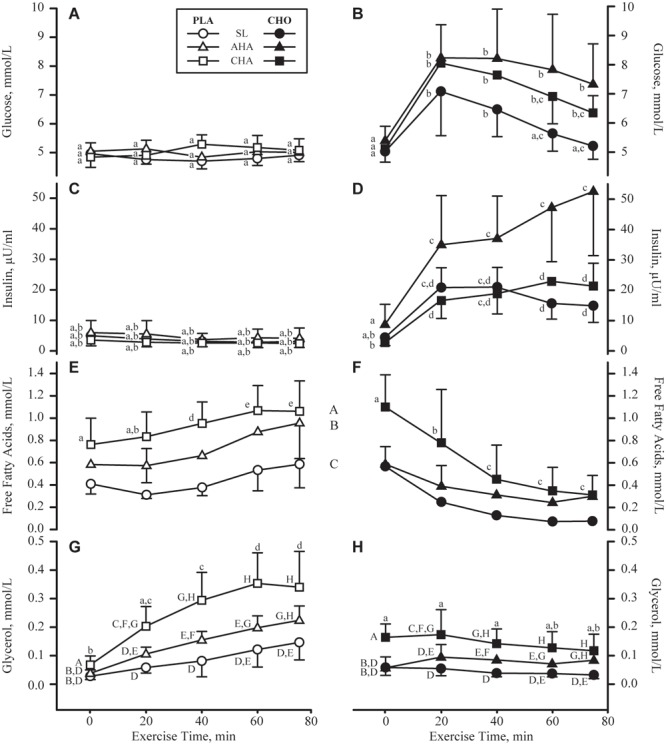
FIGURE 5.

Mean + SD of serum concentrations of glucose (mmol/L, A,B), insulin (μU/mL, C,D), free fatty acids (mmol/L, E,F) and glycerol (mmol/L, G,H) concentrations in participants provided non-nutritive placebo (PLA, n = 6, open symbols, left column of panels) or 1.8 g/min carbohydrate (CHO, n = 8, 65.25 g fructose + 79.75 g glucose, closed symbols, right column of panels) during 80-min steady-state exercise (treadmill walking) at sea level (SL) and at 4,300 m altitude, within 5–7 h after arrival (acute high-altitude, AHA) and again on the 22nd day of continuous residence at high-altitude (chronic high-altitude, CHA). For glucose and insulin, points not sharing the same lower case letter are different (treatment by phase by time interaction, P < 0.05 for both metabolites). For free fatty acids, time points not sharing the same lower case letter are different (treatment by time interaction, P < 0.05), and phases not sharing same upper case letter are different (main effect of phase, P < 0.05), no interactions). For glycerol, time points not sharing the same lower case letter are different (treatment by time interaction, P < 0.05) and time points not sharing the same upper case letter are different (time by phase interaction, P < 0.05).
