
Figure 1.
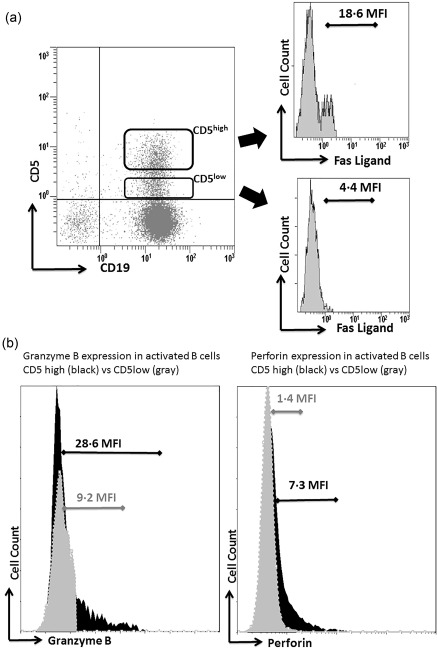
(a) Fas‐ligand (FasL) expression on CD5low and CD5hi B cells in normal individuals. A representative dot‐plot experiment presenting CD5low and CD5hi B cells in normal individuals. As can be seen, FasL expression is increased significantly on CD5hi B cells [18·6 mean fluorescence intensity (MFI)] when compared to that on CD5low (4·4 MFI) (on histogram). (b) Left panel: a representative fluorescence activated cell sorter (FACS) histogram showing increased expression of granzyme B in CD5high activated B cells (black) versus CD5low activated B cells (grey). Right panel: a representative FACS histogram showing increased expression of perforin in CD5high activated B cells (black) versus CD5low activated B cells (grey).