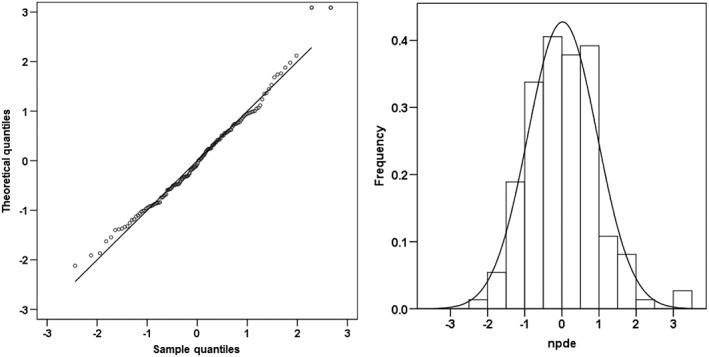
Figure 3.

Normalized prediction distribution errors (NPDE) analysis for the tacrolimus final model. NPDE: QQ‐plot of the distribution of the NPDE versus the theoretical N(0,1) distribution (left). Histogram of the distribution of the NPDE, with the density of the standard Gaussian distribution overlaid (right)
