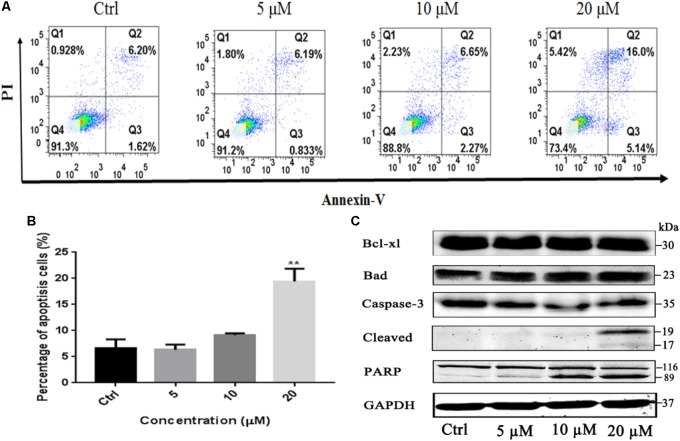
FIGURE 3.
Apoptosis effect of Gossypol on H1975 cells. Flow cytometric analysis of cell apoptosis with gossypol at different concentrations (0, 5, 10, and 20 μM) for 24 h was determined. (A) Flow cytometry analysis of the apoptosis levels of h1975 cells after treatment with gossypol for 24 h. (B) Data from (A) were statistically analyzed. Mean ± SE. ∗∗P < 0.01. (C) Western blot analysis of apoptotic markers of H1975 cells after treatment of gossypol for 24 h.

