
Figure 2.
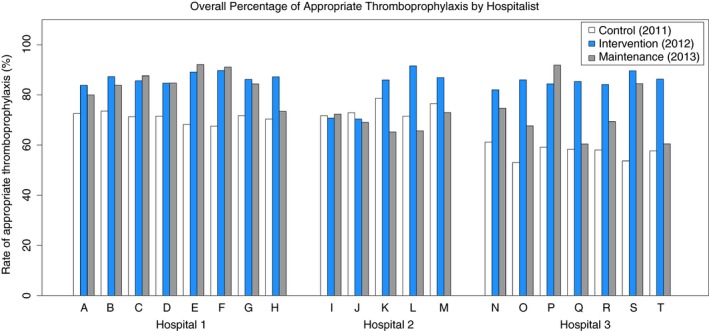
Each bar represents the annual rate of appropriate thromboprophylaxis ordered by each hospitalist (A‐T) for the control (white), intervention (blue), and maintenance (grey) years
Official websites use .gov
A
.gov website belongs to an official
government organization in the United States.
Secure .gov websites use HTTPS
A lock (
) or https:// means you've safely
connected to the .gov website. Share sensitive
information only on official, secure websites.
Each bar represents the annual rate of appropriate thromboprophylaxis ordered by each hospitalist (A‐T) for the control (white), intervention (blue), and maintenance (grey) years