
Figure 1.
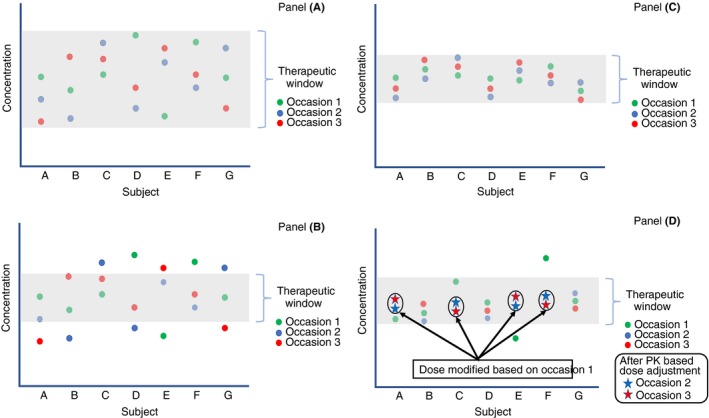
Impact of sources of variability in drug disposition and the impact of individualized dosing. The plot describes repeated measurements of drug concentrations in patients over time. The red, blue, and green dots for a given patient indicates three measurements for that patient at different times. The greyed‐out area represents the therapeutic window. Panel A describes that when the therapeutic window is larger than the variability among (IIV) and within (IOV) patients, patients have therapeutic concentrations most of the time. In this case, an average dose (either as a fixed dose or a weight‐adjusted dose) is expected to be therapeutic in most patients most of the time. Panel B describes a drug producing the same measurements as in Panel A but having a narrower therapeutic window. In this case, IIV and IOV are large relative to the therapeutic window and the relevant patient dose will need to differ amongst patients as well as within the same patient over time. Panel C describes the situation where, relative to the therapeutic window, the IIV is large and the IOV is small. In this case, deriving an individual dose from an assessment of individual PK will maintain the patient at therapeutic concentrations over time because their PK is stable (low IOV). This is the case for FVIII and FIX in persons with hemophilia. Panel D presents an example of adjusting the dose based on individual PK assessment following occasion 1 with subsequent occasions falling in the therapeutic range. This is the concept of individualized dosing of factor concentrates in persons with hemophilia