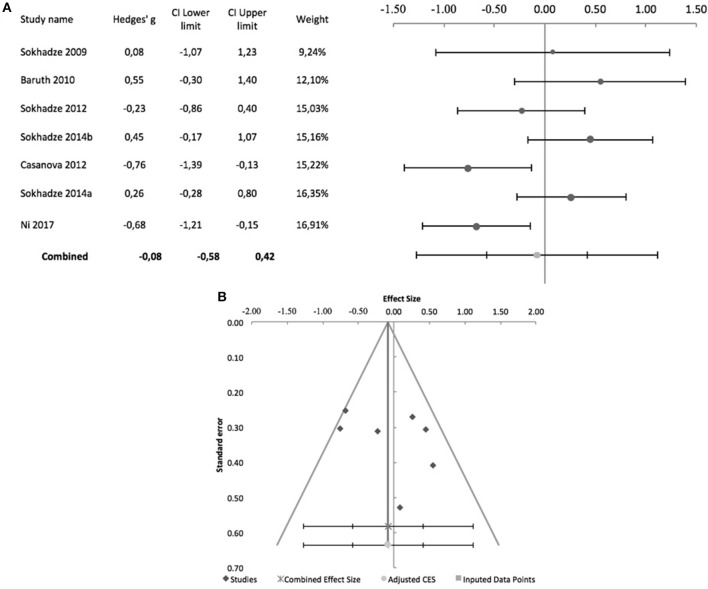
Figure 9.
Effects of rTMS on reaction time during performance of executive control tasks, in controlled studies. (A) Forest-plot. Dots represent each study, with dot size reflecting study weight in the model and error bars indicating the effect size (with confidence interval). The lower line represents the combined effect size with its confidence interval (narrow interval) and its 95% prediction interval (wide interval). (B) Funnel-plot.

