Figure 6.
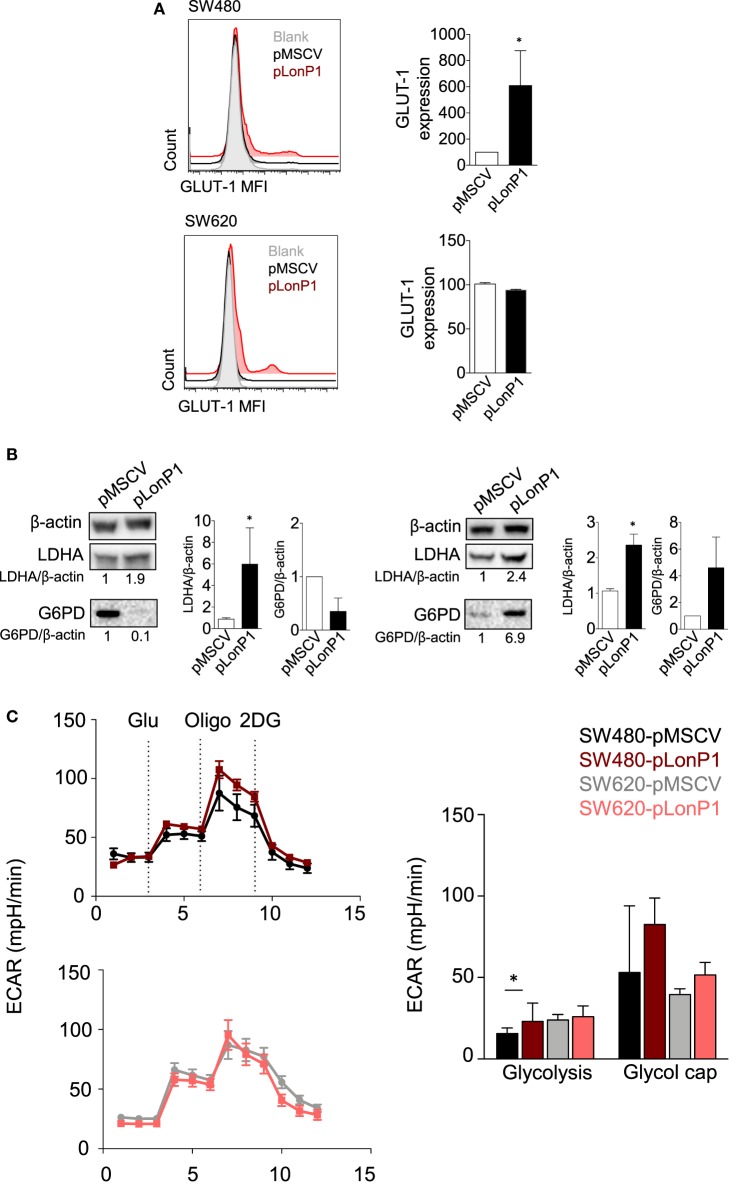
LonP1 modulates glycolytic activity in colon cancer cells. (A) Representative histograms showing glucose transporter (GLUT)-1 expression in SW480-pMSCV, SW480-pLonP1, SW620-pMSCV, and SW620-pLonP1 cells. Quantitative analysis is reported on the right and shows the median fluorescence intensity of plasma membrane GLUT-1 levels, as revealed by flow cytometry. (B) Representative Western blot analysis and relative protein levels of phosphorylated lactate dehydrogenase A and glucose 6-phosphate dehydrogenase in SW480 and SW620 cells overexpressing LonP1. β-actin was used as loading control. Densitometries are reported in histograms, and data are reported as mean ± SD (n = 3). *P < 0.05. (C) Representative traces and quantitative analysis of extracellular acidification rate in indicated cells. Subsequent injections of glucose (Glu), oligomycin (Oligo), and 2-deoxy-glucose were performed as indicated.

