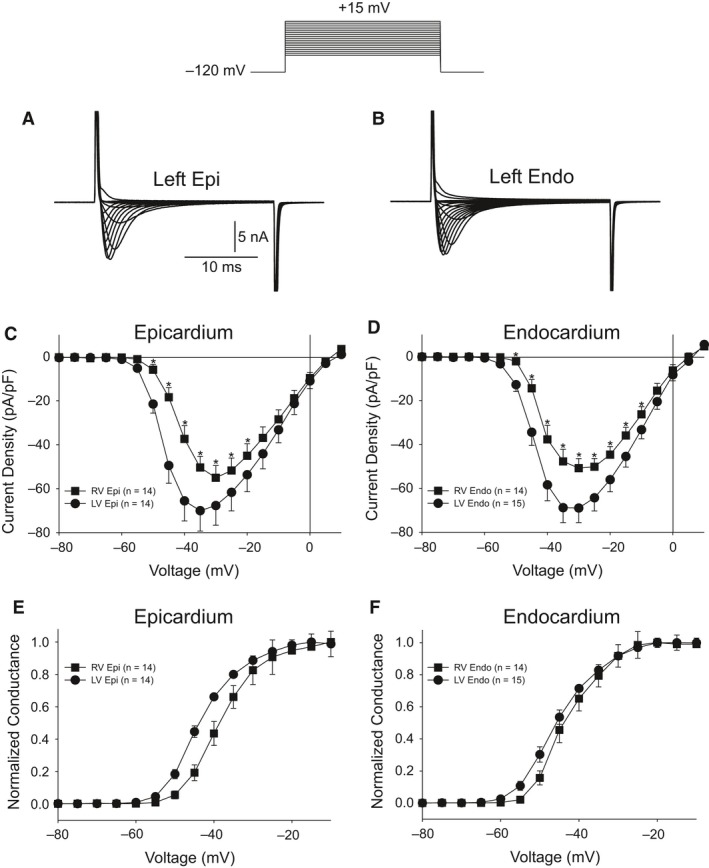
Figure 3.

Representative I Na recordings from a LV epi (A) and LV endo myocyte (B). Current recordings were obtained at test potentials between −80 and 15 mV in 5 mV increments. The holding potential was −120 mV. (C) I–V relation for RV (n = 14) and LV myocytes (n = 14) from the epicardium showing a small but significant reduction in I Na magnitude in RV epi cells. (D) I–V relation for RV (n = 14) and LV myocytes (n = 15) from the endocardium showing a small but significant reduction in I Na magnitude in RV endo cells. (E–F) Steady‐state activation relation for epi (E) and endo (F) cells. Data from the I–V curve were normalized and plotted against their test potential. *P < 0.05.
