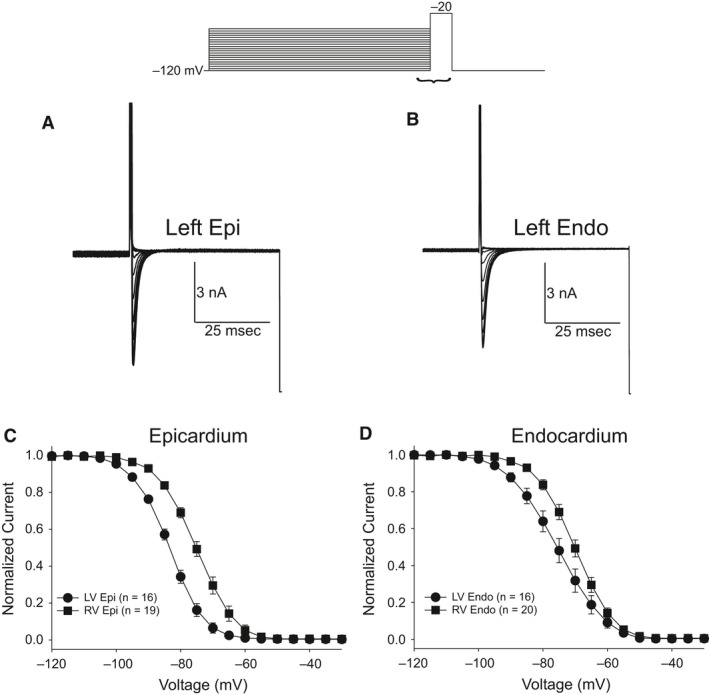
Figure 4.

Representative steady‐state inactivation recordings from a LV epi (A) and LV endo myocyte (B). At the top of figure is the voltage clamp protocol. Peak current was normalized to their respective maximum values and plotted against the conditioning potential. The mean data for the steady‐state inactivation relation for epicardium (C) and endocardium (D) are shown.
